Immigrants from Western Asia vs Osage Householder Income Over 65 years
COMPARE
Immigrants from Western Asia
Osage
Householder Income Over 65 years
Householder Income Over 65 years Comparison
Immigrants from Western Asia
Osage
$62,645
HOUSEHOLDER INCOME OVER 65 YEARS
85.3/ 100
METRIC RATING
131st/ 347
METRIC RANK
$55,677
HOUSEHOLDER INCOME OVER 65 YEARS
0.4/ 100
METRIC RATING
252nd/ 347
METRIC RANK
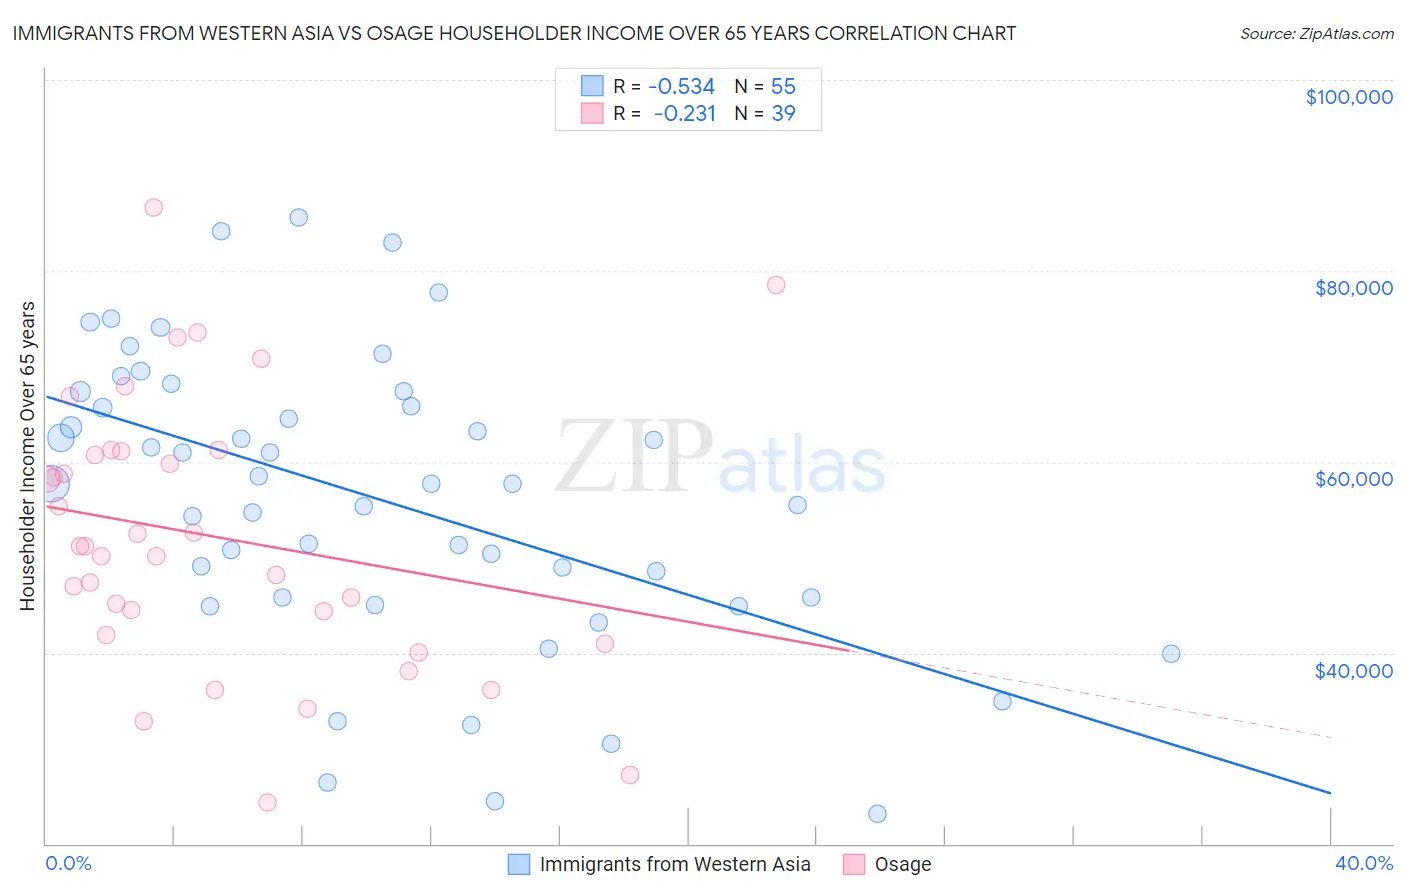
Immigrants from Western Asia vs Osage Householder Income Over 65 years Correlation Chart
The statistical analysis conducted on geographies consisting of 403,207,496 people shows a substantial negative correlation between the proportion of Immigrants from Western Asia and household income with householder over the age of 65 in the United States with a correlation coefficient (R) of -0.534 and weighted average of $62,645. Similarly, the statistical analysis conducted on geographies consisting of 91,730,498 people shows a weak negative correlation between the proportion of Osage and household income with householder over the age of 65 in the United States with a correlation coefficient (R) of -0.231 and weighted average of $55,677, a difference of 12.5%.
Householder Income Over 65 years Correlation Summary
| Measurement | Immigrants from Western Asia | Osage |
| Minimum | $23,175 | $24,375 |
| Maximum | $85,627 | $86,625 |
| Range | $62,452 | $62,250 |
| Mean | $56,169 | $52,145 |
| Median | $57,680 | $51,151 |
| Interquartile 25% (IQ1) | $45,754 | $41,874 |
| Interquartile 75% (IQ3) | $67,361 | $61,145 |
| Interquartile Range (IQR) | $21,607 | $19,271 |
| Standard Deviation (Sample) | $15,144 | $14,116 |
| Standard Deviation (Population) | $15,006 | $13,934 |
Similar Demographics by Householder Income Over 65 years
Demographics Similar to Immigrants from Western Asia by Householder Income Over 65 years
In terms of householder income over 65 years, the demographic groups most similar to Immigrants from Western Asia are Basque ($62,653, a difference of 0.010%), Immigrants from Eastern Europe ($62,693, a difference of 0.080%), Aleut ($62,708, a difference of 0.10%), Swedish ($62,736, a difference of 0.15%), and Immigrants from Germany ($62,544, a difference of 0.16%).
| Demographics | Rating | Rank | Householder Income Over 65 years |
| Taiwanese | 88.3 /100 | #124 | Excellent $62,894 |
| Soviet Union | 87.8 /100 | #125 | Excellent $62,848 |
| Peruvians | 86.8 /100 | #126 | Excellent $62,766 |
| Swedes | 86.4 /100 | #127 | Excellent $62,736 |
| Aleuts | 86.1 /100 | #128 | Excellent $62,708 |
| Immigrants | Eastern Europe | 85.9 /100 | #129 | Excellent $62,693 |
| Basques | 85.4 /100 | #130 | Excellent $62,653 |
| Immigrants | Western Asia | 85.3 /100 | #131 | Excellent $62,645 |
| Immigrants | Germany | 83.9 /100 | #132 | Excellent $62,544 |
| Immigrants | Northern Africa | 83.6 /100 | #133 | Excellent $62,522 |
| Immigrants | Brazil | 81.2 /100 | #134 | Excellent $62,364 |
| Immigrants | Chile | 81.0 /100 | #135 | Excellent $62,354 |
| Alaskan Athabascans | 80.6 /100 | #136 | Excellent $62,330 |
| Immigrants | Syria | 80.2 /100 | #137 | Excellent $62,303 |
| Immigrants | Kazakhstan | 80.0 /100 | #138 | Excellent $62,292 |
Demographics Similar to Osage by Householder Income Over 65 years
In terms of householder income over 65 years, the demographic groups most similar to Osage are Immigrants from Trinidad and Tobago ($55,598, a difference of 0.14%), American ($55,527, a difference of 0.27%), Immigrants from Portugal ($55,924, a difference of 0.44%), Immigrants from Bangladesh ($55,394, a difference of 0.51%), and Immigrants from Bosnia and Herzegovina ($55,986, a difference of 0.55%).
| Demographics | Rating | Rank | Householder Income Over 65 years |
| Immigrants | Uzbekistan | 0.8 /100 | #245 | Tragic $56,331 |
| Central Americans | 0.8 /100 | #246 | Tragic $56,321 |
| Yakama | 0.7 /100 | #247 | Tragic $56,234 |
| Vietnamese | 0.6 /100 | #248 | Tragic $56,143 |
| Mexican American Indians | 0.6 /100 | #249 | Tragic $56,089 |
| Immigrants | Bosnia and Herzegovina | 0.5 /100 | #250 | Tragic $55,986 |
| Immigrants | Portugal | 0.5 /100 | #251 | Tragic $55,924 |
| Osage | 0.4 /100 | #252 | Tragic $55,677 |
| Immigrants | Trinidad and Tobago | 0.4 /100 | #253 | Tragic $55,598 |
| Americans | 0.3 /100 | #254 | Tragic $55,527 |
| Immigrants | Bangladesh | 0.3 /100 | #255 | Tragic $55,394 |
| German Russians | 0.3 /100 | #256 | Tragic $55,356 |
| Trinidadians and Tobagonians | 0.3 /100 | #257 | Tragic $55,327 |
| Ecuadorians | 0.2 /100 | #258 | Tragic $54,958 |
| West Indians | 0.2 /100 | #259 | Tragic $54,936 |