Immigrants from Western Asia vs Immigrants from Uzbekistan Median Earnings
COMPARE
Immigrants from Western Asia
Immigrants from Uzbekistan
Median Earnings
Median Earnings Comparison
Immigrants from Western Asia
Immigrants from Uzbekistan
$49,389
MEDIAN EARNINGS
98.4/ 100
METRIC RATING
105th/ 347
METRIC RANK
$50,151
MEDIAN EARNINGS
99.5/ 100
METRIC RATING
87th/ 347
METRIC RANK
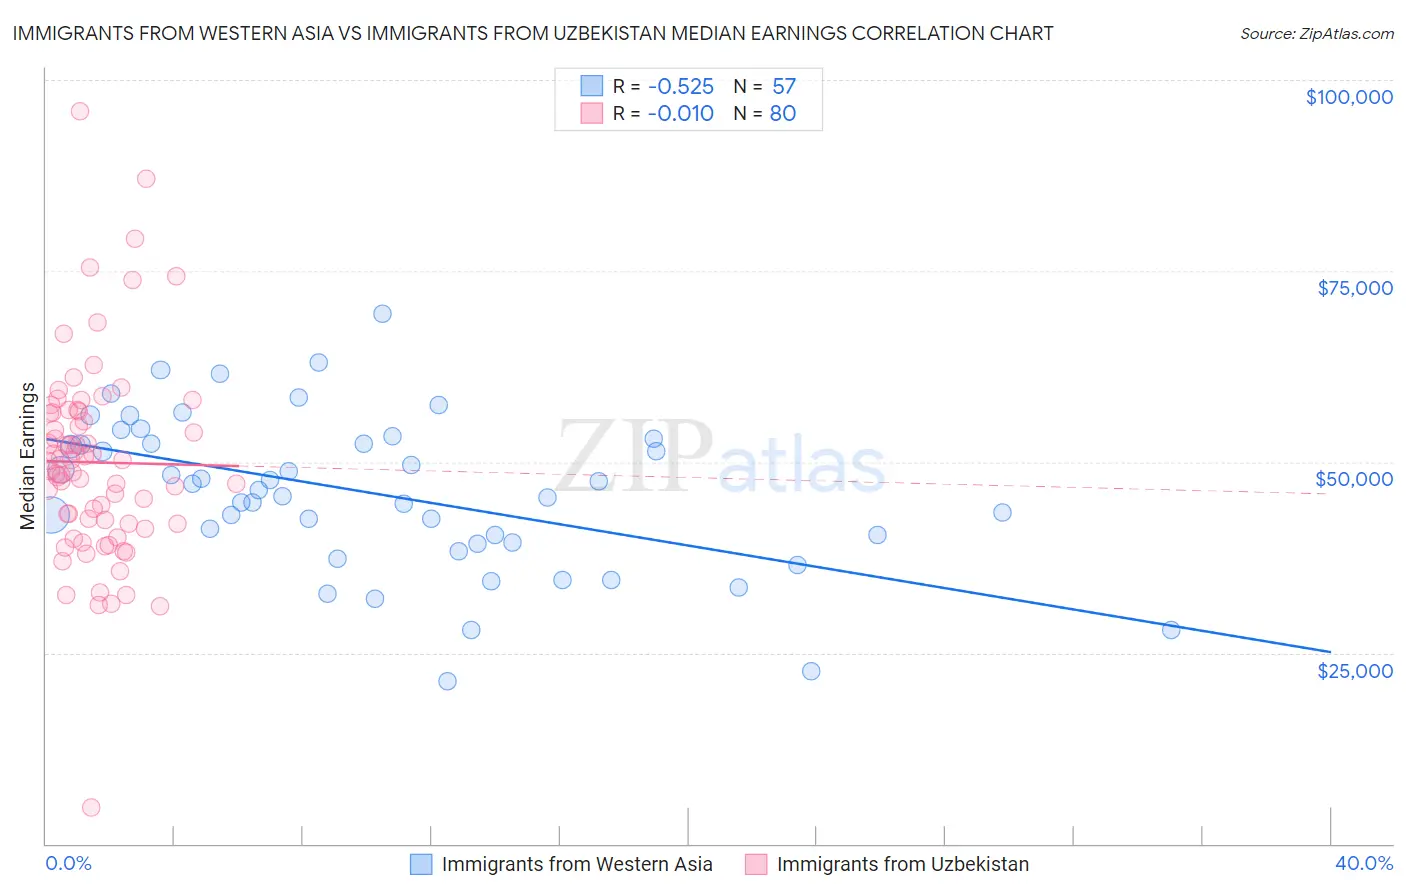
Immigrants from Western Asia vs Immigrants from Uzbekistan Median Earnings Correlation Chart
The statistical analysis conducted on geographies consisting of 404,426,866 people shows a substantial negative correlation between the proportion of Immigrants from Western Asia and median earnings in the United States with a correlation coefficient (R) of -0.525 and weighted average of $49,389. Similarly, the statistical analysis conducted on geographies consisting of 118,764,980 people shows no correlation between the proportion of Immigrants from Uzbekistan and median earnings in the United States with a correlation coefficient (R) of -0.010 and weighted average of $50,151, a difference of 1.5%.
Median Earnings Correlation Summary
| Measurement | Immigrants from Western Asia | Immigrants from Uzbekistan |
| Minimum | $21,250 | $4,716 |
| Maximum | $69,348 | $95,833 |
| Range | $48,098 | $91,117 |
| Mean | $45,817 | $49,941 |
| Median | $46,307 | $49,455 |
| Interquartile 25% (IQ1) | $39,374 | $41,888 |
| Interquartile 75% (IQ3) | $52,673 | $56,559 |
| Interquartile Range (IQR) | $13,299 | $14,671 |
| Standard Deviation (Sample) | $10,167 | $13,280 |
| Standard Deviation (Population) | $10,077 | $13,197 |
Demographics Similar to Immigrants from Western Asia and Immigrants from Uzbekistan by Median Earnings
In terms of median earnings, the demographic groups most similar to Immigrants from Western Asia are Immigrants from Albania ($49,377, a difference of 0.020%), Immigrants from Brazil ($49,463, a difference of 0.15%), Austrian ($49,501, a difference of 0.23%), Ethiopian ($49,572, a difference of 0.37%), and Immigrants from Poland ($49,633, a difference of 0.49%). Similarly, the demographic groups most similar to Immigrants from Uzbekistan are Albanian ($50,116, a difference of 0.070%), Immigrants from Canada ($50,192, a difference of 0.080%), Immigrants from North America ($50,108, a difference of 0.090%), Italian ($49,915, a difference of 0.47%), and Macedonian ($49,893, a difference of 0.52%).
| Demographics | Rating | Rank | Median Earnings |
| Immigrants | Canada | 99.5 /100 | #86 | Exceptional $50,192 |
| Immigrants | Uzbekistan | 99.5 /100 | #87 | Exceptional $50,151 |
| Albanians | 99.4 /100 | #88 | Exceptional $50,116 |
| Immigrants | North America | 99.4 /100 | #89 | Exceptional $50,108 |
| Italians | 99.3 /100 | #90 | Exceptional $49,915 |
| Macedonians | 99.2 /100 | #91 | Exceptional $49,893 |
| Immigrants | Argentina | 99.2 /100 | #92 | Exceptional $49,841 |
| Armenians | 99.1 /100 | #93 | Exceptional $49,804 |
| Croatians | 99.0 /100 | #94 | Exceptional $49,724 |
| Immigrants | England | 99.0 /100 | #95 | Exceptional $49,722 |
| Immigrants | Lebanon | 99.0 /100 | #96 | Exceptional $49,682 |
| Immigrants | North Macedonia | 98.9 /100 | #97 | Exceptional $49,658 |
| Immigrants | Northern Africa | 98.9 /100 | #98 | Exceptional $49,648 |
| Immigrants | Afghanistan | 98.9 /100 | #99 | Exceptional $49,645 |
| Immigrants | Poland | 98.9 /100 | #100 | Exceptional $49,633 |
| Jordanians | 98.9 /100 | #101 | Exceptional $49,632 |
| Ethiopians | 98.8 /100 | #102 | Exceptional $49,572 |
| Austrians | 98.7 /100 | #103 | Exceptional $49,501 |
| Immigrants | Brazil | 98.6 /100 | #104 | Exceptional $49,463 |
| Immigrants | Western Asia | 98.4 /100 | #105 | Exceptional $49,389 |
| Immigrants | Albania | 98.4 /100 | #106 | Exceptional $49,377 |