Immigrants from Western Africa vs Afghan Householder Income Over 65 years
COMPARE
Immigrants from Western Africa
Afghan
Householder Income Over 65 years
Householder Income Over 65 years Comparison
Immigrants from Western Africa
Afghans
$57,119
HOUSEHOLDER INCOME OVER 65 YEARS
1.7/ 100
METRIC RATING
233rd/ 347
METRIC RANK
$68,951
HOUSEHOLDER INCOME OVER 65 YEARS
100.0/ 100
METRIC RATING
31st/ 347
METRIC RANK
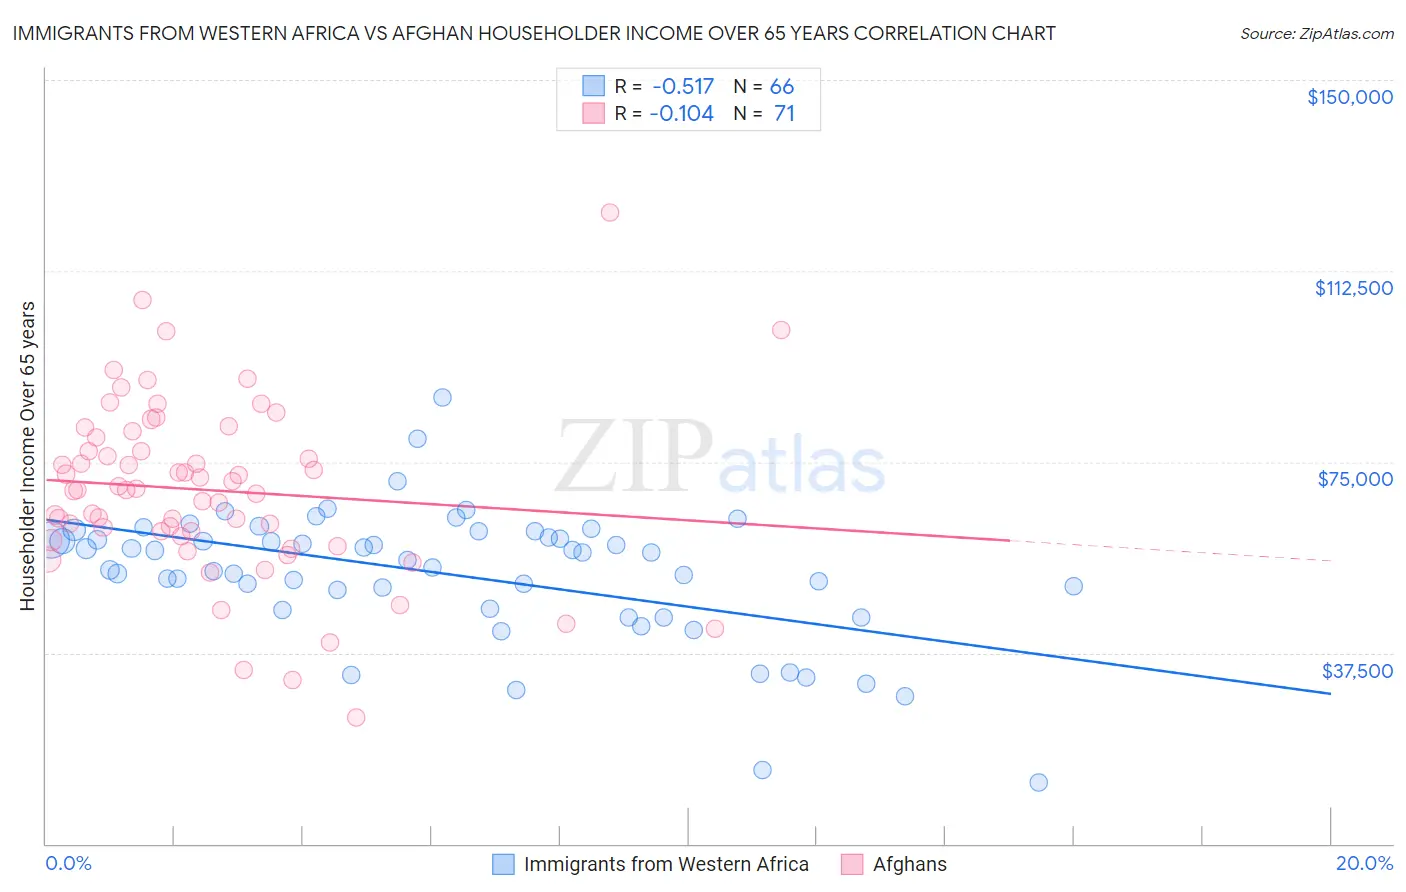
Immigrants from Western Africa vs Afghan Householder Income Over 65 years Correlation Chart
The statistical analysis conducted on geographies consisting of 356,345,193 people shows a substantial negative correlation between the proportion of Immigrants from Western Africa and household income with householder over the age of 65 in the United States with a correlation coefficient (R) of -0.517 and weighted average of $57,119. Similarly, the statistical analysis conducted on geographies consisting of 148,636,797 people shows a poor negative correlation between the proportion of Afghans and household income with householder over the age of 65 in the United States with a correlation coefficient (R) of -0.104 and weighted average of $68,951, a difference of 20.7%.
Householder Income Over 65 years Correlation Summary
| Measurement | Immigrants from Western Africa | Afghan |
| Minimum | $12,021 | $24,819 |
| Maximum | $87,727 | $123,958 |
| Range | $75,706 | $99,139 |
| Mean | $52,989 | $69,454 |
| Median | $56,535 | $69,432 |
| Interquartile 25% (IQ1) | $46,214 | $60,485 |
| Interquartile 75% (IQ3) | $60,055 | $79,700 |
| Interquartile Range (IQR) | $13,840 | $19,215 |
| Standard Deviation (Sample) | $13,149 | $17,247 |
| Standard Deviation (Population) | $13,049 | $17,125 |
Similar Demographics by Householder Income Over 65 years
Demographics Similar to Immigrants from Western Africa by Householder Income Over 65 years
In terms of householder income over 65 years, the demographic groups most similar to Immigrants from Western Africa are Immigrants from Burma/Myanmar ($57,114, a difference of 0.010%), Spanish American ($57,021, a difference of 0.17%), Immigrants from Uruguay ($56,975, a difference of 0.25%), Immigrants from Panama ($56,944, a difference of 0.31%), and Immigrants from Venezuela ($57,371, a difference of 0.44%).
| Demographics | Rating | Rank | Householder Income Over 65 years |
| French Canadians | 4.2 /100 | #226 | Tragic $57,975 |
| Japanese | 3.9 /100 | #227 | Tragic $57,919 |
| Immigrants | Albania | 3.6 /100 | #228 | Tragic $57,828 |
| Immigrants | Colombia | 3.0 /100 | #229 | Tragic $57,658 |
| Immigrants | Cambodia | 2.8 /100 | #230 | Tragic $57,580 |
| Immigrants | Nonimmigrants | 2.4 /100 | #231 | Tragic $57,426 |
| Immigrants | Venezuela | 2.3 /100 | #232 | Tragic $57,371 |
| Immigrants | Western Africa | 1.7 /100 | #233 | Tragic $57,119 |
| Immigrants | Burma/Myanmar | 1.7 /100 | #234 | Tragic $57,114 |
| Spanish Americans | 1.6 /100 | #235 | Tragic $57,021 |
| Immigrants | Uruguay | 1.5 /100 | #236 | Tragic $56,975 |
| Immigrants | Panama | 1.5 /100 | #237 | Tragic $56,944 |
| Fijians | 1.2 /100 | #238 | Tragic $56,768 |
| Immigrants | Laos | 1.2 /100 | #239 | Tragic $56,722 |
| Sub-Saharan Africans | 1.0 /100 | #240 | Tragic $56,615 |
Demographics Similar to Afghans by Householder Income Over 65 years
In terms of householder income over 65 years, the demographic groups most similar to Afghans are Immigrants from Northern Europe ($69,003, a difference of 0.070%), Asian ($68,822, a difference of 0.19%), Immigrants from Denmark ($68,801, a difference of 0.22%), Immigrants from Australia ($69,164, a difference of 0.31%), and Immigrants from China ($69,174, a difference of 0.32%).
| Demographics | Rating | Rank | Householder Income Over 65 years |
| Immigrants | Sweden | 100.0 /100 | #24 | Exceptional $69,722 |
| Immigrants | Belgium | 100.0 /100 | #25 | Exceptional $69,703 |
| Immigrants | Sri Lanka | 100.0 /100 | #26 | Exceptional $69,426 |
| Immigrants | Switzerland | 100.0 /100 | #27 | Exceptional $69,343 |
| Immigrants | China | 100.0 /100 | #28 | Exceptional $69,174 |
| Immigrants | Australia | 100.0 /100 | #29 | Exceptional $69,164 |
| Immigrants | Northern Europe | 100.0 /100 | #30 | Exceptional $69,003 |
| Afghans | 100.0 /100 | #31 | Exceptional $68,951 |
| Asians | 100.0 /100 | #32 | Exceptional $68,822 |
| Immigrants | Denmark | 100.0 /100 | #33 | Exceptional $68,801 |
| Immigrants | Ireland | 100.0 /100 | #34 | Exceptional $68,495 |
| Tongans | 100.0 /100 | #35 | Exceptional $68,235 |
| Immigrants | Austria | 99.9 /100 | #36 | Exceptional $68,208 |
| Turks | 99.9 /100 | #37 | Exceptional $68,037 |
| Estonians | 99.9 /100 | #38 | Exceptional $67,926 |