Immigrants from West Indies vs German Russian Median Family Income
COMPARE
Immigrants from West Indies
German Russian
Median Family Income
Median Family Income Comparison
Immigrants from West Indies
German Russians
$91,588
MEDIAN FAMILY INCOME
0.3/ 100
METRIC RATING
263rd/ 347
METRIC RANK
$93,858
MEDIAN FAMILY INCOME
1.1/ 100
METRIC RATING
243rd/ 347
METRIC RANK
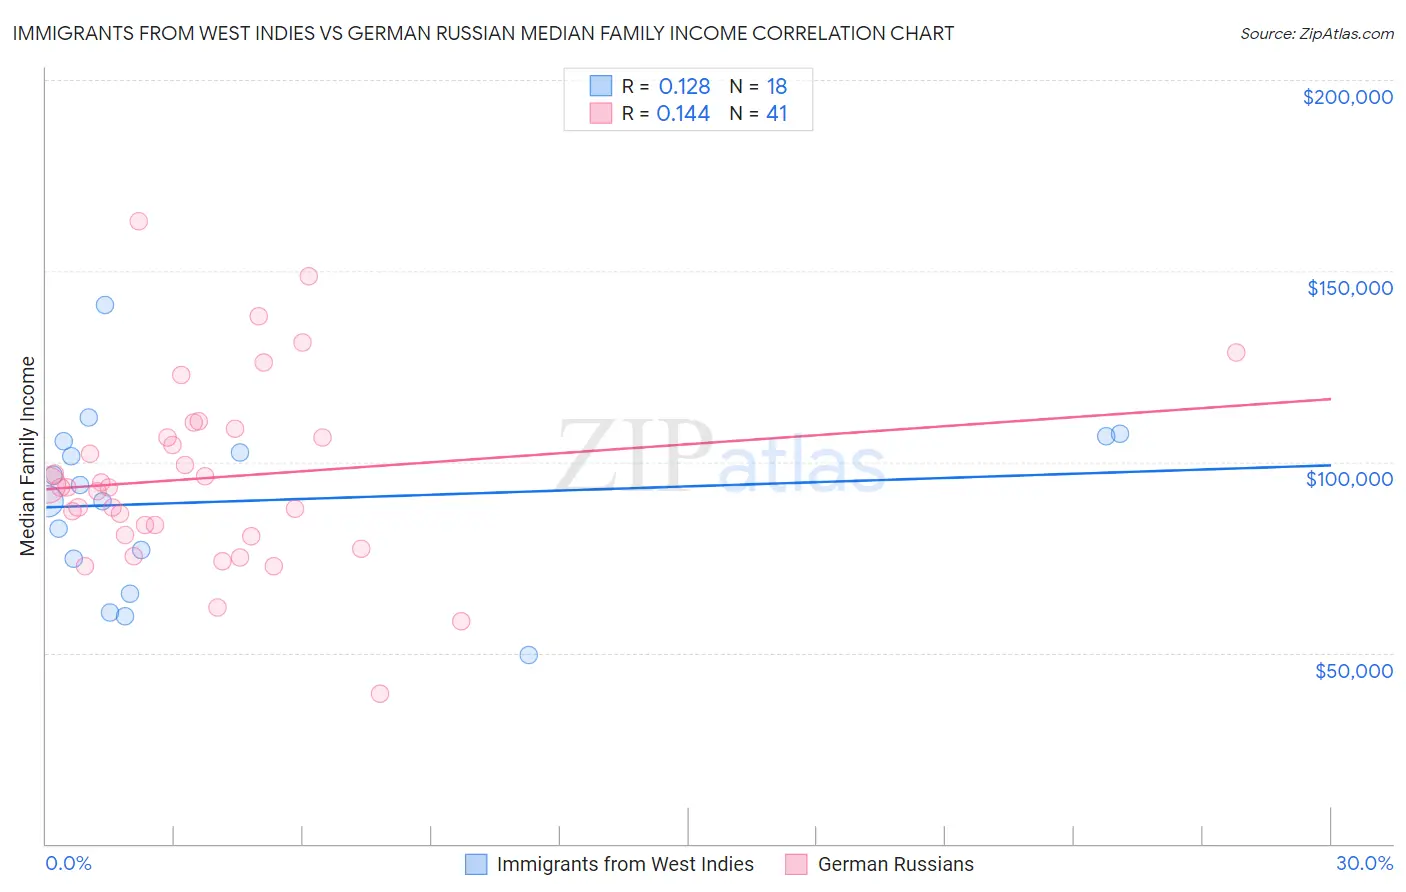
Immigrants from West Indies vs German Russian Median Family Income Correlation Chart
The statistical analysis conducted on geographies consisting of 72,412,445 people shows a poor positive correlation between the proportion of Immigrants from West Indies and median family income in the United States with a correlation coefficient (R) of 0.128 and weighted average of $91,588. Similarly, the statistical analysis conducted on geographies consisting of 96,441,626 people shows a poor positive correlation between the proportion of German Russians and median family income in the United States with a correlation coefficient (R) of 0.144 and weighted average of $93,858, a difference of 2.5%.
Median Family Income Correlation Summary
| Measurement | Immigrants from West Indies | German Russian |
| Minimum | $49,539 | $39,167 |
| Maximum | $141,054 | $163,128 |
| Range | $91,515 | $123,961 |
| Mean | $89,730 | $95,905 |
| Median | $91,813 | $93,261 |
| Interquartile 25% (IQ1) | $74,771 | $80,798 |
| Interquartile 75% (IQ3) | $105,524 | $107,632 |
| Interquartile Range (IQR) | $30,753 | $26,834 |
| Standard Deviation (Sample) | $22,647 | $24,350 |
| Standard Deviation (Population) | $22,009 | $24,051 |
Demographics Similar to Immigrants from West Indies and German Russians by Median Family Income
In terms of median family income, the demographic groups most similar to Immigrants from West Indies are Liberian ($91,722, a difference of 0.15%), Inupiat ($91,730, a difference of 0.16%), Pennsylvania German ($91,763, a difference of 0.19%), Cape Verdean ($91,848, a difference of 0.28%), and Osage ($91,926, a difference of 0.37%). Similarly, the demographic groups most similar to German Russians are Subsaharan African ($93,748, a difference of 0.12%), Immigrants from Middle Africa ($93,593, a difference of 0.28%), Guyanese ($93,373, a difference of 0.52%), Immigrants from Senegal ($92,912, a difference of 1.0%), and French American Indian ($92,872, a difference of 1.1%).
| Demographics | Rating | Rank | Median Family Income |
| German Russians | 1.1 /100 | #243 | Tragic $93,858 |
| Sub-Saharan Africans | 1.0 /100 | #244 | Tragic $93,748 |
| Immigrants | Middle Africa | 1.0 /100 | #245 | Tragic $93,593 |
| Guyanese | 0.9 /100 | #246 | Tragic $93,373 |
| Immigrants | Senegal | 0.7 /100 | #247 | Tragic $92,912 |
| French American Indians | 0.7 /100 | #248 | Tragic $92,872 |
| Immigrants | Ecuador | 0.7 /100 | #249 | Tragic $92,837 |
| West Indians | 0.6 /100 | #250 | Tragic $92,765 |
| Immigrants | Somalia | 0.6 /100 | #251 | Tragic $92,609 |
| Immigrants | El Salvador | 0.6 /100 | #252 | Tragic $92,545 |
| Immigrants | Guyana | 0.6 /100 | #253 | Tragic $92,513 |
| Immigrants | Barbados | 0.5 /100 | #254 | Tragic $92,419 |
| Immigrants | Laos | 0.5 /100 | #255 | Tragic $92,239 |
| Nicaraguans | 0.5 /100 | #256 | Tragic $92,231 |
| Americans | 0.4 /100 | #257 | Tragic $92,096 |
| Osage | 0.4 /100 | #258 | Tragic $91,926 |
| Cape Verdeans | 0.4 /100 | #259 | Tragic $91,848 |
| Pennsylvania Germans | 0.4 /100 | #260 | Tragic $91,763 |
| Inupiat | 0.4 /100 | #261 | Tragic $91,730 |
| Liberians | 0.4 /100 | #262 | Tragic $91,722 |
| Immigrants | West Indies | 0.3 /100 | #263 | Tragic $91,588 |