Immigrants from Vietnam vs French Median Male Earnings
COMPARE
Immigrants from Vietnam
French
Median Male Earnings
Median Male Earnings Comparison
Immigrants from Vietnam
French
$54,913
MEDIAN MALE EARNINGS
60.2/ 100
METRIC RATING
168th/ 347
METRIC RANK
$55,350
MEDIAN MALE EARNINGS
69.9/ 100
METRIC RATING
162nd/ 347
METRIC RANK
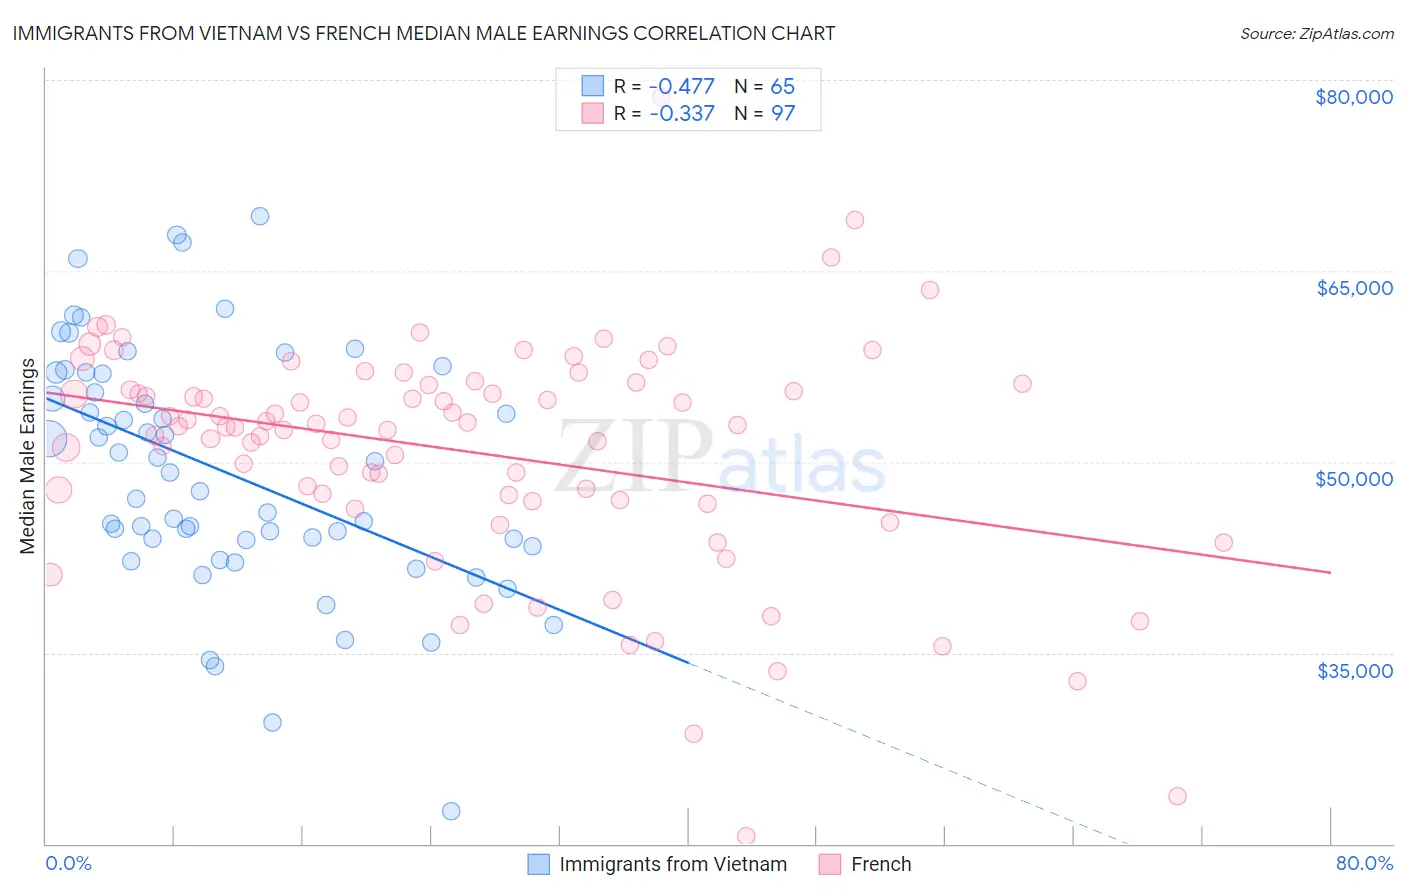
Immigrants from Vietnam vs French Median Male Earnings Correlation Chart
The statistical analysis conducted on geographies consisting of 404,603,118 people shows a moderate negative correlation between the proportion of Immigrants from Vietnam and median male earnings in the United States with a correlation coefficient (R) of -0.477 and weighted average of $54,913. Similarly, the statistical analysis conducted on geographies consisting of 571,095,815 people shows a mild negative correlation between the proportion of French and median male earnings in the United States with a correlation coefficient (R) of -0.337 and weighted average of $55,350, a difference of 0.80%.
Median Male Earnings Correlation Summary
| Measurement | Immigrants from Vietnam | French |
| Minimum | $22,532 | $20,556 |
| Maximum | $69,274 | $78,663 |
| Range | $46,742 | $58,107 |
| Mean | $49,248 | $50,816 |
| Median | $49,189 | $52,806 |
| Interquartile 25% (IQ1) | $43,623 | $46,933 |
| Interquartile 75% (IQ3) | $56,949 | $56,096 |
| Interquartile Range (IQR) | $13,326 | $9,162 |
| Standard Deviation (Sample) | $9,503 | $9,122 |
| Standard Deviation (Population) | $9,429 | $9,075 |
Demographics Similar to Immigrants from Vietnam and French by Median Male Earnings
In terms of median male earnings, the demographic groups most similar to Immigrants from Vietnam are Immigrants from Fiji ($54,958, a difference of 0.080%), German ($54,974, a difference of 0.11%), French Canadian ($54,722, a difference of 0.35%), Finnish ($54,721, a difference of 0.35%), and Immigrants from Peru ($54,695, a difference of 0.40%). Similarly, the demographic groups most similar to French are Belgian ($55,361, a difference of 0.020%), Basque ($55,370, a difference of 0.040%), Alsatian ($55,380, a difference of 0.050%), Czechoslovakian ($55,382, a difference of 0.060%), and Ugandan ($55,290, a difference of 0.11%).
| Demographics | Rating | Rank | Median Male Earnings |
| Scandinavians | 73.4 /100 | #155 | Good $55,527 |
| Immigrants | Ethiopia | 71.6 /100 | #156 | Good $55,434 |
| Icelanders | 71.2 /100 | #157 | Good $55,415 |
| Czechoslovakians | 70.5 /100 | #158 | Good $55,382 |
| Alsatians | 70.5 /100 | #159 | Good $55,380 |
| Basques | 70.3 /100 | #160 | Good $55,370 |
| Belgians | 70.1 /100 | #161 | Good $55,361 |
| French | 69.9 /100 | #162 | Good $55,350 |
| Ugandans | 68.6 /100 | #163 | Good $55,290 |
| Immigrants | South Eastern Asia | 67.6 /100 | #164 | Good $55,241 |
| Immigrants | Portugal | 66.3 /100 | #165 | Good $55,182 |
| Germans | 61.6 /100 | #166 | Good $54,974 |
| Immigrants | Fiji | 61.2 /100 | #167 | Good $54,958 |
| Immigrants | Vietnam | 60.2 /100 | #168 | Good $54,913 |
| French Canadians | 55.6 /100 | #169 | Average $54,722 |
| Finns | 55.6 /100 | #170 | Average $54,721 |
| Immigrants | Peru | 54.9 /100 | #171 | Average $54,695 |
| Welsh | 53.8 /100 | #172 | Average $54,647 |
| South American Indians | 50.4 /100 | #173 | Average $54,508 |
| South Americans | 50.0 /100 | #174 | Average $54,492 |
| Dutch | 48.0 /100 | #175 | Average $54,410 |