Immigrants from Uruguay vs Bermudan Median Household Income
COMPARE
Immigrants from Uruguay
Bermudan
Median Household Income
Median Household Income Comparison
Immigrants from Uruguay
Bermudans
$82,560
MEDIAN HOUSEHOLD INCOME
16.4/ 100
METRIC RATING
210th/ 347
METRIC RANK
$80,406
MEDIAN HOUSEHOLD INCOME
4.7/ 100
METRIC RATING
230th/ 347
METRIC RANK
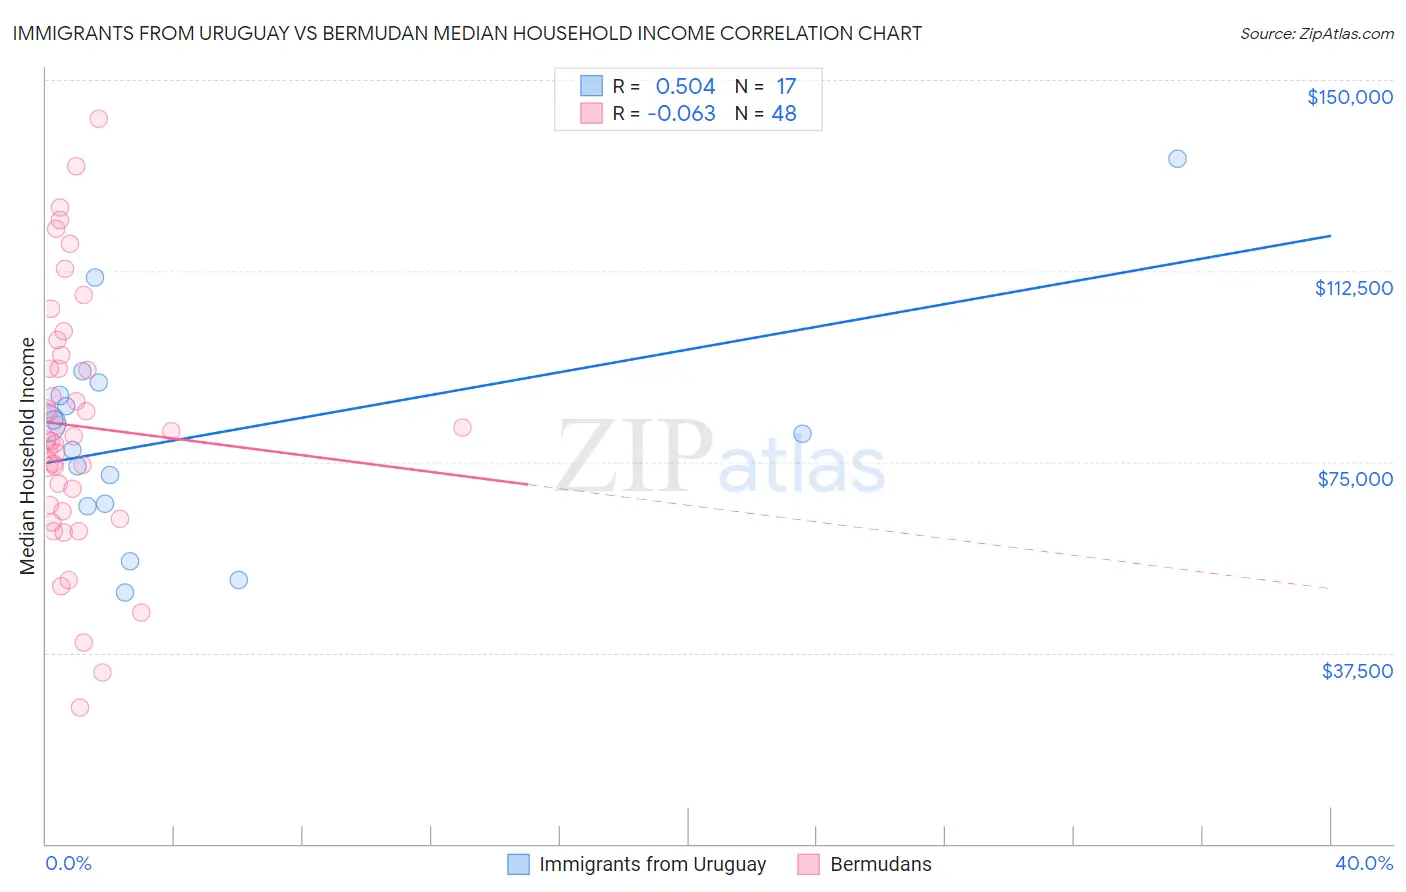
Immigrants from Uruguay vs Bermudan Median Household Income Correlation Chart
The statistical analysis conducted on geographies consisting of 133,237,976 people shows a substantial positive correlation between the proportion of Immigrants from Uruguay and median household income in the United States with a correlation coefficient (R) of 0.504 and weighted average of $82,560. Similarly, the statistical analysis conducted on geographies consisting of 55,709,060 people shows a slight negative correlation between the proportion of Bermudans and median household income in the United States with a correlation coefficient (R) of -0.063 and weighted average of $80,406, a difference of 2.7%.
Median Household Income Correlation Summary
| Measurement | Immigrants from Uruguay | Bermudan |
| Minimum | $49,241 | $26,741 |
| Maximum | $134,635 | $142,500 |
| Range | $85,394 | $115,759 |
| Mean | $80,181 | $82,030 |
| Median | $80,417 | $79,684 |
| Interquartile 25% (IQ1) | $66,523 | $65,991 |
| Interquartile 75% (IQ3) | $89,275 | $94,631 |
| Interquartile Range (IQR) | $22,752 | $28,640 |
| Standard Deviation (Sample) | $21,157 | $25,052 |
| Standard Deviation (Population) | $20,525 | $24,789 |
Demographics Similar to Immigrants from Uruguay and Bermudans by Median Household Income
In terms of median household income, the demographic groups most similar to Immigrants from Uruguay are Salvadoran ($82,449, a difference of 0.14%), Venezuelan ($82,432, a difference of 0.16%), Nepalese ($82,410, a difference of 0.18%), Panamanian ($82,272, a difference of 0.35%), and Vietnamese ($82,248, a difference of 0.38%). Similarly, the demographic groups most similar to Bermudans are Delaware ($80,527, a difference of 0.15%), Immigrants from Bangladesh ($80,722, a difference of 0.39%), Guyanese ($80,734, a difference of 0.41%), Immigrants from Panama ($80,873, a difference of 0.58%), and Scotch-Irish ($80,972, a difference of 0.70%).
| Demographics | Rating | Rank | Median Household Income |
| Immigrants | Uruguay | 16.4 /100 | #210 | Poor $82,560 |
| Salvadorans | 15.4 /100 | #211 | Poor $82,449 |
| Venezuelans | 15.3 /100 | #212 | Poor $82,432 |
| Nepalese | 15.1 /100 | #213 | Poor $82,410 |
| Panamanians | 14.0 /100 | #214 | Poor $82,272 |
| Vietnamese | 13.8 /100 | #215 | Poor $82,248 |
| Yugoslavians | 13.3 /100 | #216 | Poor $82,186 |
| Ecuadorians | 12.5 /100 | #217 | Poor $82,070 |
| Whites/Caucasians | 12.2 /100 | #218 | Poor $82,029 |
| Nigerians | 10.3 /100 | #219 | Poor $81,725 |
| Immigrants | Venezuela | 9.0 /100 | #220 | Tragic $81,506 |
| Immigrants | Ghana | 9.0 /100 | #221 | Tragic $81,489 |
| Immigrants | Nigeria | 7.7 /100 | #222 | Tragic $81,236 |
| Immigrants | El Salvador | 7.6 /100 | #223 | Tragic $81,213 |
| Malaysians | 7.0 /100 | #224 | Tragic $81,064 |
| Scotch-Irish | 6.6 /100 | #225 | Tragic $80,972 |
| Immigrants | Panama | 6.2 /100 | #226 | Tragic $80,873 |
| Guyanese | 5.7 /100 | #227 | Tragic $80,734 |
| Immigrants | Bangladesh | 5.7 /100 | #228 | Tragic $80,722 |
| Delaware | 5.0 /100 | #229 | Tragic $80,527 |
| Bermudans | 4.7 /100 | #230 | Tragic $80,406 |