Immigrants from Uganda vs Peruvian Median Male Earnings
COMPARE
Immigrants from Uganda
Peruvian
Median Male Earnings
Median Male Earnings Comparison
Immigrants from Uganda
Peruvians
$56,064
MEDIAN MALE EARNINGS
82.4/ 100
METRIC RATING
144th/ 347
METRIC RANK
$55,659
MEDIAN MALE EARNINGS
75.8/ 100
METRIC RATING
152nd/ 347
METRIC RANK
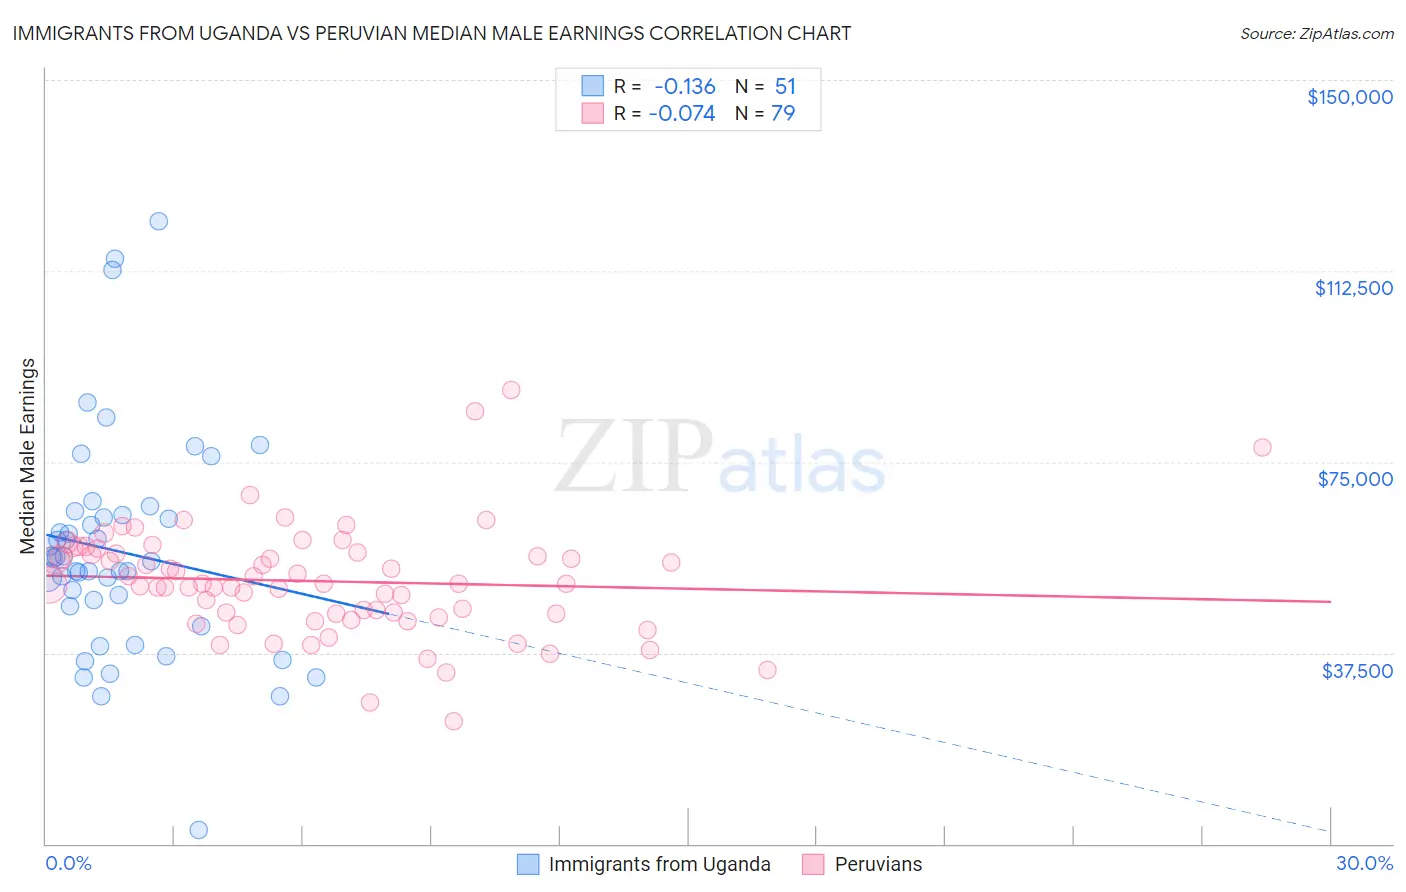
Immigrants from Uganda vs Peruvian Median Male Earnings Correlation Chart
The statistical analysis conducted on geographies consisting of 125,972,834 people shows a poor negative correlation between the proportion of Immigrants from Uganda and median male earnings in the United States with a correlation coefficient (R) of -0.136 and weighted average of $56,064. Similarly, the statistical analysis conducted on geographies consisting of 363,195,834 people shows a slight negative correlation between the proportion of Peruvians and median male earnings in the United States with a correlation coefficient (R) of -0.074 and weighted average of $55,659, a difference of 0.73%.
Median Male Earnings Correlation Summary
| Measurement | Immigrants from Uganda | Peruvian |
| Minimum | $2,614 | $23,965 |
| Maximum | $122,344 | $89,196 |
| Range | $119,730 | $65,231 |
| Mean | $57,441 | $51,595 |
| Median | $56,129 | $51,069 |
| Interquartile 25% (IQ1) | $46,713 | $45,232 |
| Interquartile 75% (IQ3) | $64,485 | $57,176 |
| Interquartile Range (IQR) | $17,772 | $11,944 |
| Standard Deviation (Sample) | $21,598 | $10,827 |
| Standard Deviation (Population) | $21,385 | $10,758 |
Demographics Similar to Immigrants from Uganda and Peruvians by Median Male Earnings
In terms of median male earnings, the demographic groups most similar to Immigrants from Uganda are Sri Lankan ($56,136, a difference of 0.13%), Norwegian ($55,965, a difference of 0.18%), Immigrants from Chile ($55,954, a difference of 0.20%), Danish ($56,246, a difference of 0.32%), and Ethiopian ($56,243, a difference of 0.32%). Similarly, the demographic groups most similar to Peruvians are Immigrants from Nepal ($55,615, a difference of 0.080%), Immigrants from Oceania ($55,712, a difference of 0.10%), Swiss ($55,731, a difference of 0.13%), English ($55,747, a difference of 0.16%), and Taiwanese ($55,556, a difference of 0.19%).
| Demographics | Rating | Rank | Median Male Earnings |
| Slovaks | 85.5 /100 | #138 | Excellent $56,306 |
| Zimbabweans | 85.5 /100 | #139 | Excellent $56,302 |
| Luxembourgers | 85.5 /100 | #140 | Excellent $56,300 |
| Danes | 84.8 /100 | #141 | Excellent $56,246 |
| Ethiopians | 84.8 /100 | #142 | Excellent $56,243 |
| Sri Lankans | 83.4 /100 | #143 | Excellent $56,136 |
| Immigrants | Uganda | 82.4 /100 | #144 | Excellent $56,064 |
| Norwegians | 80.9 /100 | #145 | Excellent $55,965 |
| Immigrants | Chile | 80.7 /100 | #146 | Excellent $55,954 |
| Immigrants | Philippines | 78.4 /100 | #147 | Good $55,809 |
| Scottish | 78.2 /100 | #148 | Good $55,793 |
| English | 77.4 /100 | #149 | Good $55,747 |
| Swiss | 77.1 /100 | #150 | Good $55,731 |
| Immigrants | Oceania | 76.8 /100 | #151 | Good $55,712 |
| Peruvians | 75.8 /100 | #152 | Good $55,659 |
| Immigrants | Nepal | 75.0 /100 | #153 | Good $55,615 |
| Taiwanese | 73.9 /100 | #154 | Good $55,556 |
| Scandinavians | 73.4 /100 | #155 | Good $55,527 |
| Immigrants | Ethiopia | 71.6 /100 | #156 | Good $55,434 |
| Icelanders | 71.2 /100 | #157 | Good $55,415 |
| Czechoslovakians | 70.5 /100 | #158 | Good $55,382 |