Immigrants from Trinidad and Tobago vs Nigerian Median Male Earnings
COMPARE
Immigrants from Trinidad and Tobago
Nigerian
Median Male Earnings
Median Male Earnings Comparison
Immigrants from Trinidad and Tobago
Nigerians
$51,376
MEDIAN MALE EARNINGS
4.5/ 100
METRIC RATING
229th/ 347
METRIC RANK
$52,039
MEDIAN MALE EARNINGS
8.3/ 100
METRIC RATING
217th/ 347
METRIC RANK
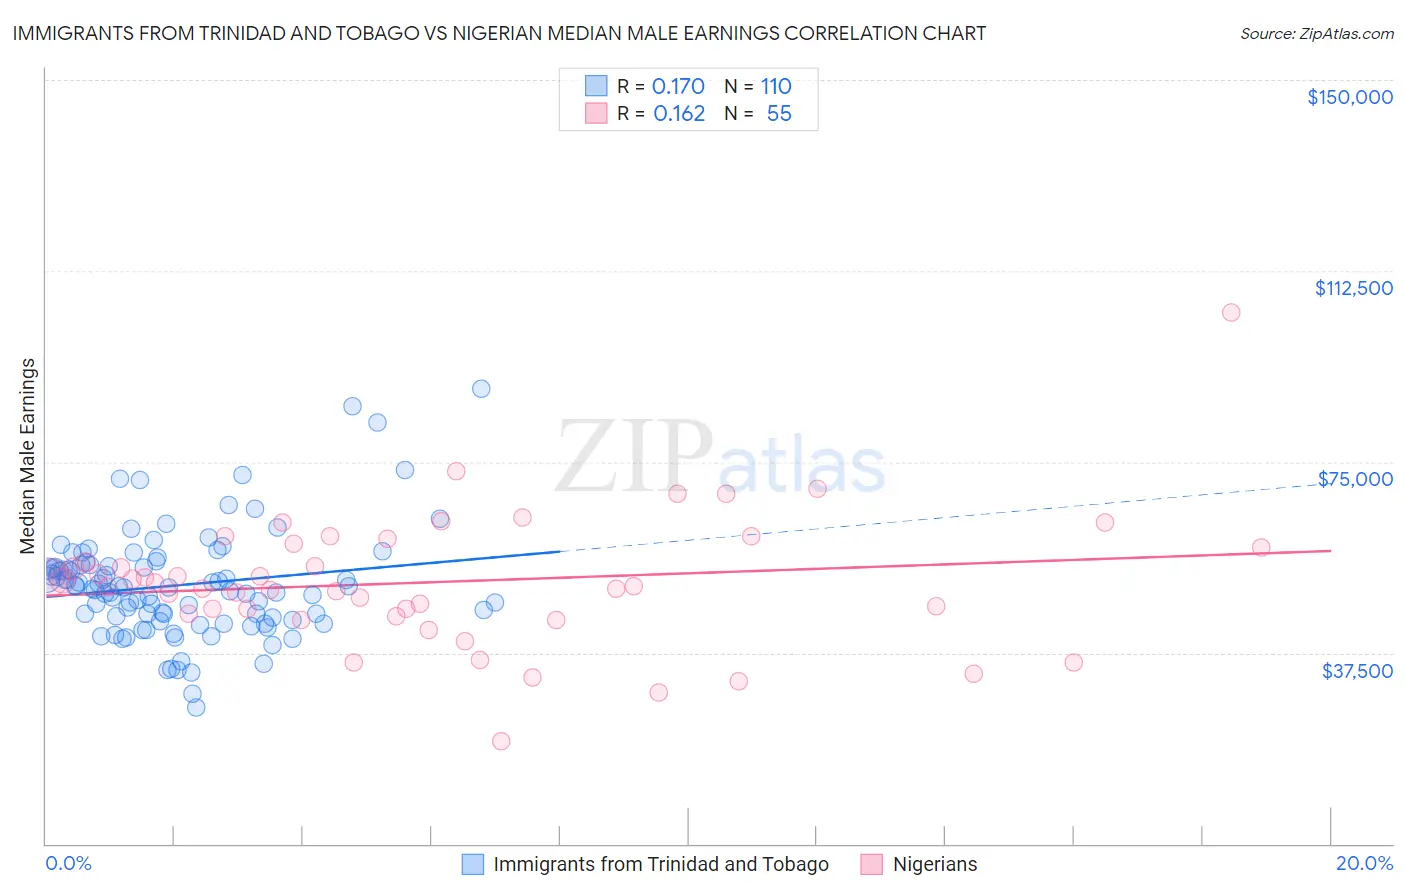
Immigrants from Trinidad and Tobago vs Nigerian Median Male Earnings Correlation Chart
The statistical analysis conducted on geographies consisting of 223,506,487 people shows a poor positive correlation between the proportion of Immigrants from Trinidad and Tobago and median male earnings in the United States with a correlation coefficient (R) of 0.170 and weighted average of $51,376. Similarly, the statistical analysis conducted on geographies consisting of 332,727,024 people shows a poor positive correlation between the proportion of Nigerians and median male earnings in the United States with a correlation coefficient (R) of 0.162 and weighted average of $52,039, a difference of 1.3%.
Median Male Earnings Correlation Summary
| Measurement | Immigrants from Trinidad and Tobago | Nigerian |
| Minimum | $26,715 | $20,187 |
| Maximum | $89,464 | $104,375 |
| Range | $62,749 | $84,188 |
| Mean | $50,788 | $51,399 |
| Median | $50,334 | $50,552 |
| Interquartile 25% (IQ1) | $44,350 | $45,099 |
| Interquartile 75% (IQ3) | $54,816 | $58,900 |
| Interquartile Range (IQR) | $10,466 | $13,801 |
| Standard Deviation (Sample) | $10,499 | $12,955 |
| Standard Deviation (Population) | $10,451 | $12,837 |
Demographics Similar to Immigrants from Trinidad and Tobago and Nigerians by Median Male Earnings
In terms of median male earnings, the demographic groups most similar to Immigrants from Trinidad and Tobago are Samoan ($51,389, a difference of 0.030%), Immigrants from Nigeria ($51,310, a difference of 0.13%), Trinidadian and Tobagonian ($51,446, a difference of 0.14%), Japanese ($51,473, a difference of 0.19%), and Immigrants from Sudan ($51,489, a difference of 0.22%). Similarly, the demographic groups most similar to Nigerians are Immigrants from Venezuela ($52,041, a difference of 0.0%), Immigrants from Cameroon ($52,119, a difference of 0.15%), Immigrants from Panama ($51,962, a difference of 0.15%), Nonimmigrants ($52,170, a difference of 0.25%), and Immigrants from Ghana ($51,836, a difference of 0.39%).
| Demographics | Rating | Rank | Median Male Earnings |
| Native Hawaiians | 10.5 /100 | #213 | Poor $52,306 |
| Immigrants | Nonimmigrants | 9.3 /100 | #214 | Tragic $52,170 |
| Immigrants | Cameroon | 8.9 /100 | #215 | Tragic $52,119 |
| Immigrants | Venezuela | 8.3 /100 | #216 | Tragic $52,041 |
| Nigerians | 8.3 /100 | #217 | Tragic $52,039 |
| Immigrants | Panama | 7.7 /100 | #218 | Tragic $51,962 |
| Immigrants | Ghana | 6.9 /100 | #219 | Tragic $51,836 |
| Immigrants | Armenia | 6.6 /100 | #220 | Tragic $51,793 |
| Immigrants | Senegal | 5.8 /100 | #221 | Tragic $51,647 |
| Immigrants | Bangladesh | 5.8 /100 | #222 | Tragic $51,642 |
| Ecuadorians | 5.5 /100 | #223 | Tragic $51,596 |
| Immigrants | Cambodia | 5.5 /100 | #224 | Tragic $51,594 |
| Immigrants | Sudan | 5.0 /100 | #225 | Tragic $51,489 |
| Japanese | 4.9 /100 | #226 | Tragic $51,473 |
| Trinidadians and Tobagonians | 4.8 /100 | #227 | Tragic $51,446 |
| Samoans | 4.6 /100 | #228 | Tragic $51,389 |
| Immigrants | Trinidad and Tobago | 4.5 /100 | #229 | Tragic $51,376 |
| Immigrants | Nigeria | 4.2 /100 | #230 | Tragic $51,310 |
| Barbadians | 3.9 /100 | #231 | Tragic $51,236 |
| Sudanese | 3.9 /100 | #232 | Tragic $51,216 |
| Aleuts | 3.7 /100 | #233 | Tragic $51,168 |