Immigrants from Thailand vs Colville Householder Income Ages 25 - 44 years
COMPARE
Immigrants from Thailand
Colville
Householder Income Ages 25 - 44 years
Householder Income Ages 25 - 44 years Comparison
Immigrants from Thailand
Colville
$91,337
HOUSEHOLDER INCOME AGES 25 - 44 YEARS
14.3/ 100
METRIC RATING
208th/ 347
METRIC RANK
$82,604
HOUSEHOLDER INCOME AGES 25 - 44 YEARS
0.1/ 100
METRIC RATING
280th/ 347
METRIC RANK
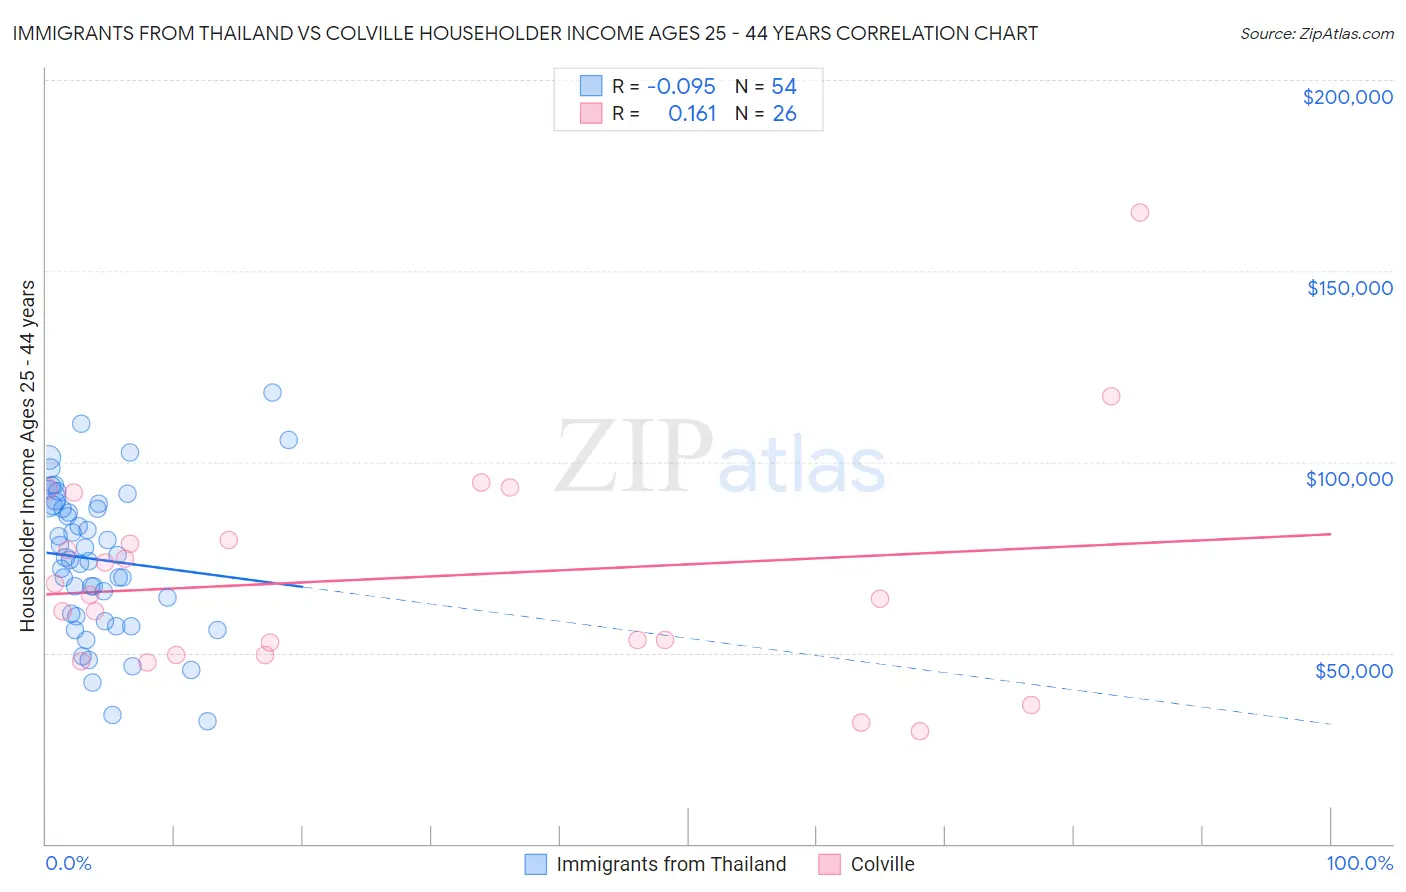
Immigrants from Thailand vs Colville Householder Income Ages 25 - 44 years Correlation Chart
The statistical analysis conducted on geographies consisting of 316,454,000 people shows a slight negative correlation between the proportion of Immigrants from Thailand and household income with householder between the ages 25 and 44 in the United States with a correlation coefficient (R) of -0.095 and weighted average of $91,337. Similarly, the statistical analysis conducted on geographies consisting of 34,657,772 people shows a poor positive correlation between the proportion of Colville and household income with householder between the ages 25 and 44 in the United States with a correlation coefficient (R) of 0.161 and weighted average of $82,604, a difference of 10.6%.
Householder Income Ages 25 - 44 years Correlation Summary
| Measurement | Immigrants from Thailand | Colville |
| Minimum | $32,083 | $29,375 |
| Maximum | $118,125 | $165,278 |
| Range | $86,042 | $135,903 |
| Mean | $74,382 | $69,577 |
| Median | $74,631 | $64,641 |
| Interquartile 25% (IQ1) | $59,491 | $49,583 |
| Interquartile 75% (IQ3) | $88,604 | $79,688 |
| Interquartile Range (IQR) | $29,112 | $30,105 |
| Standard Deviation (Sample) | $19,277 | $28,891 |
| Standard Deviation (Population) | $19,098 | $28,330 |
Similar Demographics by Householder Income Ages 25 - 44 years
Demographics Similar to Immigrants from Thailand by Householder Income Ages 25 - 44 years
In terms of householder income ages 25 - 44 years, the demographic groups most similar to Immigrants from Thailand are Yugoslavian ($91,368, a difference of 0.030%), Aleut ($91,370, a difference of 0.040%), Immigrants from Eastern Africa ($91,458, a difference of 0.13%), Nepalese ($91,498, a difference of 0.18%), and Immigrants from Uruguay ($91,171, a difference of 0.18%).
| Demographics | Rating | Rank | Householder Income Ages 25 - 44 years |
| Japanese | 16.4 /100 | #201 | Poor $91,624 |
| Ecuadorians | 16.0 /100 | #202 | Poor $91,574 |
| Immigrants | Cambodia | 15.7 /100 | #203 | Poor $91,533 |
| Nepalese | 15.4 /100 | #204 | Poor $91,498 |
| Immigrants | Eastern Africa | 15.2 /100 | #205 | Poor $91,458 |
| Aleuts | 14.5 /100 | #206 | Poor $91,370 |
| Yugoslavians | 14.5 /100 | #207 | Poor $91,368 |
| Immigrants | Thailand | 14.3 /100 | #208 | Poor $91,337 |
| Immigrants | Uruguay | 13.2 /100 | #209 | Poor $91,171 |
| Immigrants | Kenya | 10.9 /100 | #210 | Poor $90,767 |
| Iraqis | 10.8 /100 | #211 | Poor $90,764 |
| Hawaiians | 10.6 /100 | #212 | Poor $90,722 |
| Immigrants | Bangladesh | 9.3 /100 | #213 | Tragic $90,448 |
| Immigrants | Africa | 8.9 /100 | #214 | Tragic $90,372 |
| Panamanians | 8.1 /100 | #215 | Tragic $90,193 |
Demographics Similar to Colville by Householder Income Ages 25 - 44 years
In terms of householder income ages 25 - 44 years, the demographic groups most similar to Colville are Pima ($82,821, a difference of 0.26%), Cajun ($82,393, a difference of 0.26%), Senegalese ($82,852, a difference of 0.30%), Central American Indian ($82,355, a difference of 0.30%), and Guatemalan ($82,331, a difference of 0.33%).
| Demographics | Rating | Rank | Householder Income Ages 25 - 44 years |
| Iroquois | 0.2 /100 | #273 | Tragic $83,682 |
| Marshallese | 0.2 /100 | #274 | Tragic $83,575 |
| Immigrants | Jamaica | 0.2 /100 | #275 | Tragic $83,298 |
| Immigrants | Belize | 0.2 /100 | #276 | Tragic $83,141 |
| Paiute | 0.2 /100 | #277 | Tragic $82,984 |
| Senegalese | 0.2 /100 | #278 | Tragic $82,852 |
| Pima | 0.1 /100 | #279 | Tragic $82,821 |
| Colville | 0.1 /100 | #280 | Tragic $82,604 |
| Cajuns | 0.1 /100 | #281 | Tragic $82,393 |
| Central American Indians | 0.1 /100 | #282 | Tragic $82,355 |
| Guatemalans | 0.1 /100 | #283 | Tragic $82,331 |
| Immigrants | Middle Africa | 0.1 /100 | #284 | Tragic $82,254 |
| Immigrants | Somalia | 0.1 /100 | #285 | Tragic $82,188 |
| Ute | 0.1 /100 | #286 | Tragic $82,166 |
| Immigrants | Latin America | 0.1 /100 | #287 | Tragic $82,166 |