Immigrants from Taiwan vs Guamanian/Chamorro Per Capita Income
COMPARE
Immigrants from Taiwan
Guamanian/Chamorro
Per Capita Income
Per Capita Income Comparison
Immigrants from Taiwan
Guamanians/Chamorros
$57,742
PER CAPITA INCOME
100.0/ 100
METRIC RATING
6th/ 347
METRIC RANK
$41,678
PER CAPITA INCOME
9.7/ 100
METRIC RATING
217th/ 347
METRIC RANK
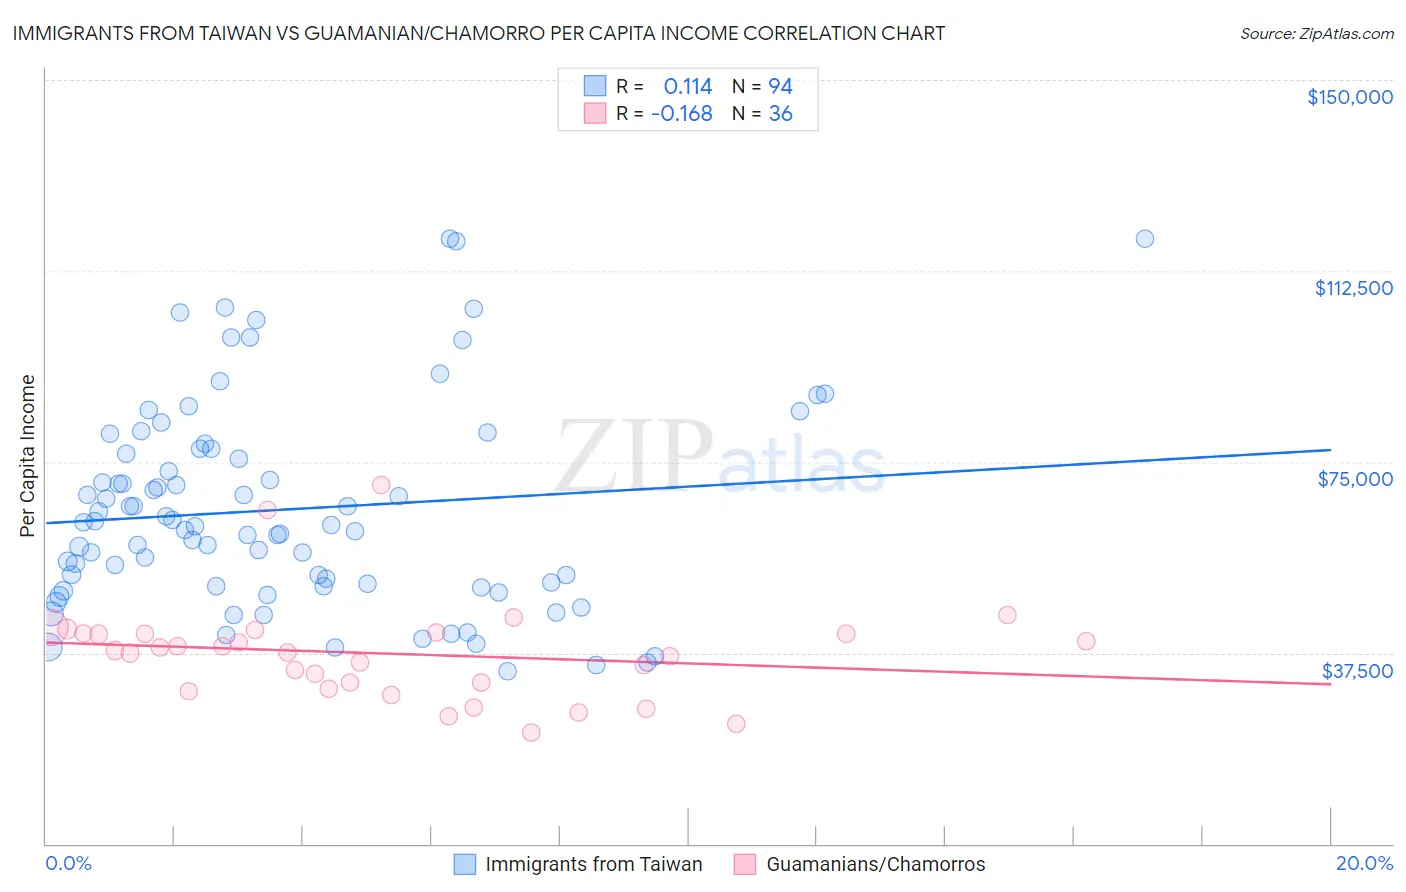
Immigrants from Taiwan vs Guamanian/Chamorro Per Capita Income Correlation Chart
The statistical analysis conducted on geographies consisting of 298,270,368 people shows a poor positive correlation between the proportion of Immigrants from Taiwan and per capita income in the United States with a correlation coefficient (R) of 0.114 and weighted average of $57,742. Similarly, the statistical analysis conducted on geographies consisting of 221,916,418 people shows a poor negative correlation between the proportion of Guamanians/Chamorros and per capita income in the United States with a correlation coefficient (R) of -0.168 and weighted average of $41,678, a difference of 38.5%.
Per Capita Income Correlation Summary
| Measurement | Immigrants from Taiwan | Guamanian/Chamorro |
| Minimum | $33,786 | $21,937 |
| Maximum | $118,914 | $70,391 |
| Range | $85,128 | $48,454 |
| Mean | $65,673 | $37,325 |
| Median | $62,475 | $37,776 |
| Interquartile 25% (IQ1) | $50,616 | $31,068 |
| Interquartile 75% (IQ3) | $77,568 | $41,275 |
| Interquartile Range (IQR) | $26,952 | $10,207 |
| Standard Deviation (Sample) | $20,163 | $9,827 |
| Standard Deviation (Population) | $20,056 | $9,689 |
Similar Demographics by Per Capita Income
Demographics Similar to Immigrants from Taiwan by Per Capita Income
In terms of per capita income, the demographic groups most similar to Immigrants from Taiwan are Immigrants from Iran ($57,759, a difference of 0.030%), Immigrants from Australia ($57,953, a difference of 0.37%), Immigrants from Israel ($57,384, a difference of 0.62%), Immigrants from Singapore ($58,353, a difference of 1.1%), and Iranian ($58,786, a difference of 1.8%).
| Demographics | Rating | Rank | Per Capita Income |
| Filipinos | 100.0 /100 | #1 | Exceptional $59,066 |
| Iranians | 100.0 /100 | #2 | Exceptional $58,786 |
| Immigrants | Singapore | 100.0 /100 | #3 | Exceptional $58,353 |
| Immigrants | Australia | 100.0 /100 | #4 | Exceptional $57,953 |
| Immigrants | Iran | 100.0 /100 | #5 | Exceptional $57,759 |
| Immigrants | Taiwan | 100.0 /100 | #6 | Exceptional $57,742 |
| Immigrants | Israel | 100.0 /100 | #7 | Exceptional $57,384 |
| Immigrants | Hong Kong | 100.0 /100 | #8 | Exceptional $56,709 |
| Immigrants | Ireland | 100.0 /100 | #9 | Exceptional $56,584 |
| Okinawans | 100.0 /100 | #10 | Exceptional $55,817 |
| Eastern Europeans | 100.0 /100 | #11 | Exceptional $55,780 |
| Immigrants | Sweden | 100.0 /100 | #12 | Exceptional $55,582 |
| Immigrants | India | 100.0 /100 | #13 | Exceptional $55,268 |
| Immigrants | Belgium | 100.0 /100 | #14 | Exceptional $55,082 |
| Cypriots | 100.0 /100 | #15 | Exceptional $54,899 |
Demographics Similar to Guamanians/Chamorros by Per Capita Income
In terms of per capita income, the demographic groups most similar to Guamanians/Chamorros are Tongan ($41,693, a difference of 0.030%), Sudanese ($41,695, a difference of 0.040%), Trinidadian and Tobagonian ($41,655, a difference of 0.060%), Immigrants from Bangladesh ($41,709, a difference of 0.070%), and Immigrants from Venezuela ($41,727, a difference of 0.12%).
| Demographics | Rating | Rank | Per Capita Income |
| Ecuadorians | 12.9 /100 | #210 | Poor $41,958 |
| Immigrants | Panama | 11.6 /100 | #211 | Poor $41,853 |
| Immigrants | Senegal | 11.3 /100 | #212 | Poor $41,830 |
| Immigrants | Venezuela | 10.2 /100 | #213 | Poor $41,727 |
| Immigrants | Bangladesh | 10.1 /100 | #214 | Poor $41,709 |
| Sudanese | 9.9 /100 | #215 | Tragic $41,695 |
| Tongans | 9.9 /100 | #216 | Tragic $41,693 |
| Guamanians/Chamorros | 9.7 /100 | #217 | Tragic $41,678 |
| Trinidadians and Tobagonians | 9.5 /100 | #218 | Tragic $41,655 |
| Puget Sound Salish | 8.1 /100 | #219 | Tragic $41,495 |
| Immigrants | Barbados | 7.9 /100 | #220 | Tragic $41,478 |
| Immigrants | Trinidad and Tobago | 7.9 /100 | #221 | Tragic $41,476 |
| Immigrants | Iraq | 7.1 /100 | #222 | Tragic $41,365 |
| Immigrants | Cameroon | 6.8 /100 | #223 | Tragic $41,334 |
| Immigrants | St. Vincent and the Grenadines | 6.4 /100 | #224 | Tragic $41,270 |