Immigrants from Syria vs Immigrants from Saudi Arabia Per Capita Income
COMPARE
Immigrants from Syria
Immigrants from Saudi Arabia
Per Capita Income
Per Capita Income Comparison
Immigrants from Syria
Immigrants from Saudi Arabia
$45,218
PER CAPITA INCOME
85.2/ 100
METRIC RATING
137th/ 347
METRIC RANK
$46,008
PER CAPITA INCOME
93.3/ 100
METRIC RATING
118th/ 347
METRIC RANK
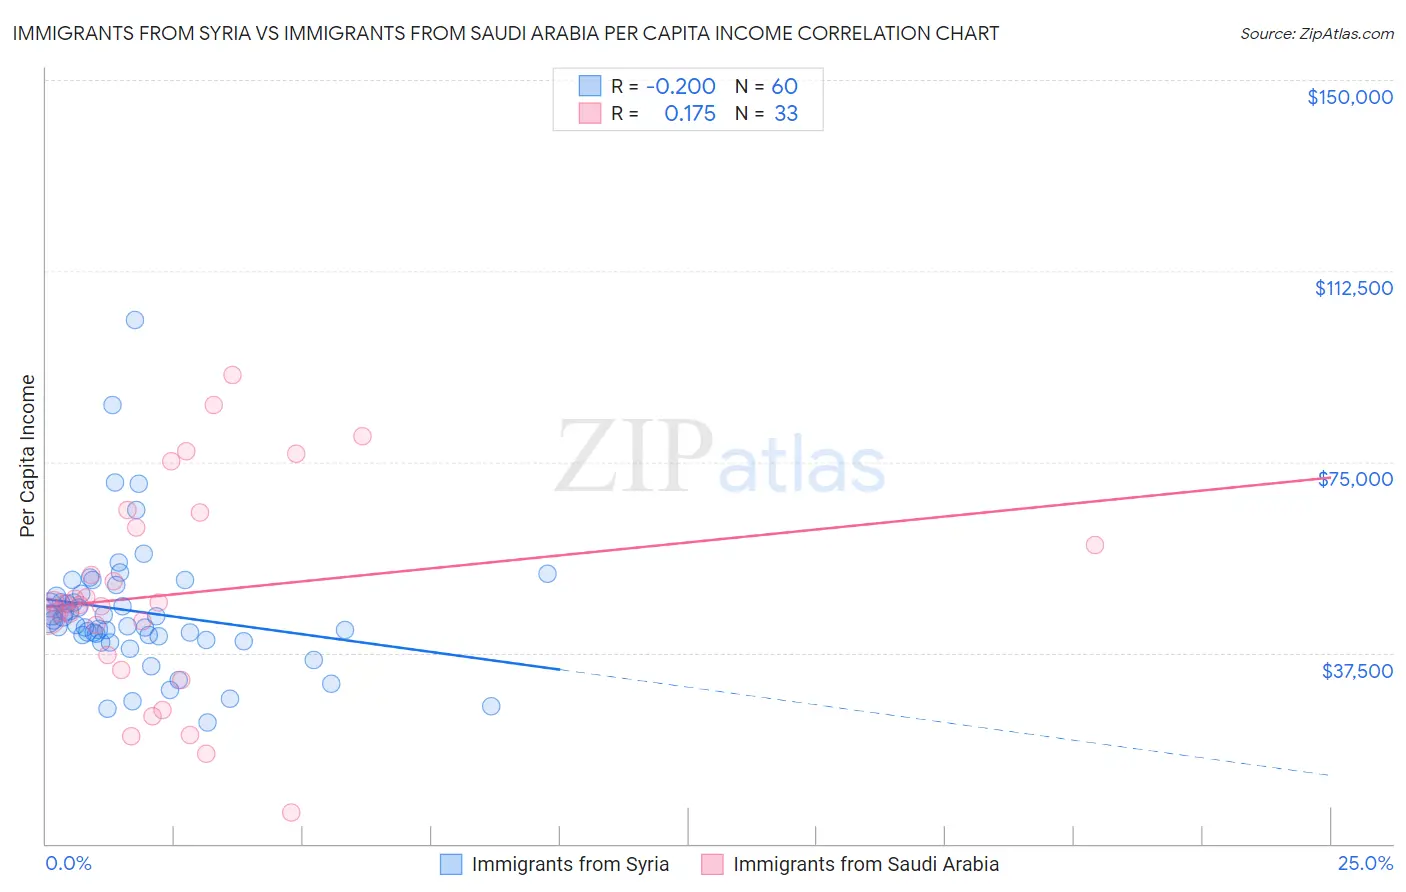
Immigrants from Syria vs Immigrants from Saudi Arabia Per Capita Income Correlation Chart
The statistical analysis conducted on geographies consisting of 174,111,110 people shows a poor negative correlation between the proportion of Immigrants from Syria and per capita income in the United States with a correlation coefficient (R) of -0.200 and weighted average of $45,218. Similarly, the statistical analysis conducted on geographies consisting of 164,297,329 people shows a poor positive correlation between the proportion of Immigrants from Saudi Arabia and per capita income in the United States with a correlation coefficient (R) of 0.175 and weighted average of $46,008, a difference of 1.8%.
Per Capita Income Correlation Summary
| Measurement | Immigrants from Syria | Immigrants from Saudi Arabia |
| Minimum | $23,901 | $6,252 |
| Maximum | $102,814 | $92,098 |
| Range | $78,913 | $85,846 |
| Mean | $45,572 | $49,029 |
| Median | $43,422 | $47,113 |
| Interquartile 25% (IQ1) | $40,433 | $35,703 |
| Interquartile 75% (IQ3) | $48,863 | $63,528 |
| Interquartile Range (IQR) | $8,430 | $27,825 |
| Standard Deviation (Sample) | $13,127 | $20,510 |
| Standard Deviation (Population) | $13,017 | $20,197 |
Demographics Similar to Immigrants from Syria and Immigrants from Saudi Arabia by Per Capita Income
In terms of per capita income, the demographic groups most similar to Immigrants from Syria are Immigrants from Oceania ($45,220, a difference of 0.0%), Hungarian ($45,426, a difference of 0.46%), Slovene ($45,581, a difference of 0.80%), Pakistani ($45,587, a difference of 0.82%), and Jordanian ($45,605, a difference of 0.86%). Similarly, the demographic groups most similar to Immigrants from Saudi Arabia are Immigrants from Poland ($45,979, a difference of 0.060%), Chinese ($46,098, a difference of 0.19%), Immigrants from Ethiopia ($45,923, a difference of 0.19%), Canadian ($45,858, a difference of 0.33%), and Moroccan ($45,854, a difference of 0.34%).
| Demographics | Rating | Rank | Per Capita Income |
| Chinese | 93.9 /100 | #117 | Exceptional $46,098 |
| Immigrants | Saudi Arabia | 93.3 /100 | #118 | Exceptional $46,008 |
| Immigrants | Poland | 93.1 /100 | #119 | Exceptional $45,979 |
| Immigrants | Ethiopia | 92.7 /100 | #120 | Exceptional $45,923 |
| Canadians | 92.2 /100 | #121 | Exceptional $45,858 |
| Moroccans | 92.1 /100 | #122 | Exceptional $45,854 |
| Lebanese | 92.0 /100 | #123 | Exceptional $45,840 |
| Europeans | 92.0 /100 | #124 | Exceptional $45,836 |
| Zimbabweans | 91.7 /100 | #125 | Exceptional $45,804 |
| Palestinians | 91.6 /100 | #126 | Exceptional $45,790 |
| Immigrants | Germany | 91.3 /100 | #127 | Exceptional $45,751 |
| Swedes | 91.3 /100 | #128 | Exceptional $45,750 |
| Luxembourgers | 90.4 /100 | #129 | Exceptional $45,663 |
| Arabs | 90.4 /100 | #130 | Exceptional $45,662 |
| Immigrants | North Macedonia | 90.0 /100 | #131 | Exceptional $45,622 |
| Jordanians | 89.9 /100 | #132 | Excellent $45,605 |
| Pakistanis | 89.7 /100 | #133 | Excellent $45,587 |
| Slovenes | 89.6 /100 | #134 | Excellent $45,581 |
| Hungarians | 87.9 /100 | #135 | Excellent $45,426 |
| Immigrants | Oceania | 85.2 /100 | #136 | Excellent $45,220 |
| Immigrants | Syria | 85.2 /100 | #137 | Excellent $45,218 |