Immigrants from Switzerland vs Immigrants from Lithuania Median Male Earnings
COMPARE
Immigrants from Switzerland
Immigrants from Lithuania
Median Male Earnings
Median Male Earnings Comparison
Immigrants from Switzerland
Immigrants from Lithuania
$63,944
MEDIAN MALE EARNINGS
100.0/ 100
METRIC RATING
27th/ 347
METRIC RANK
$63,346
MEDIAN MALE EARNINGS
100.0/ 100
METRIC RATING
33rd/ 347
METRIC RANK
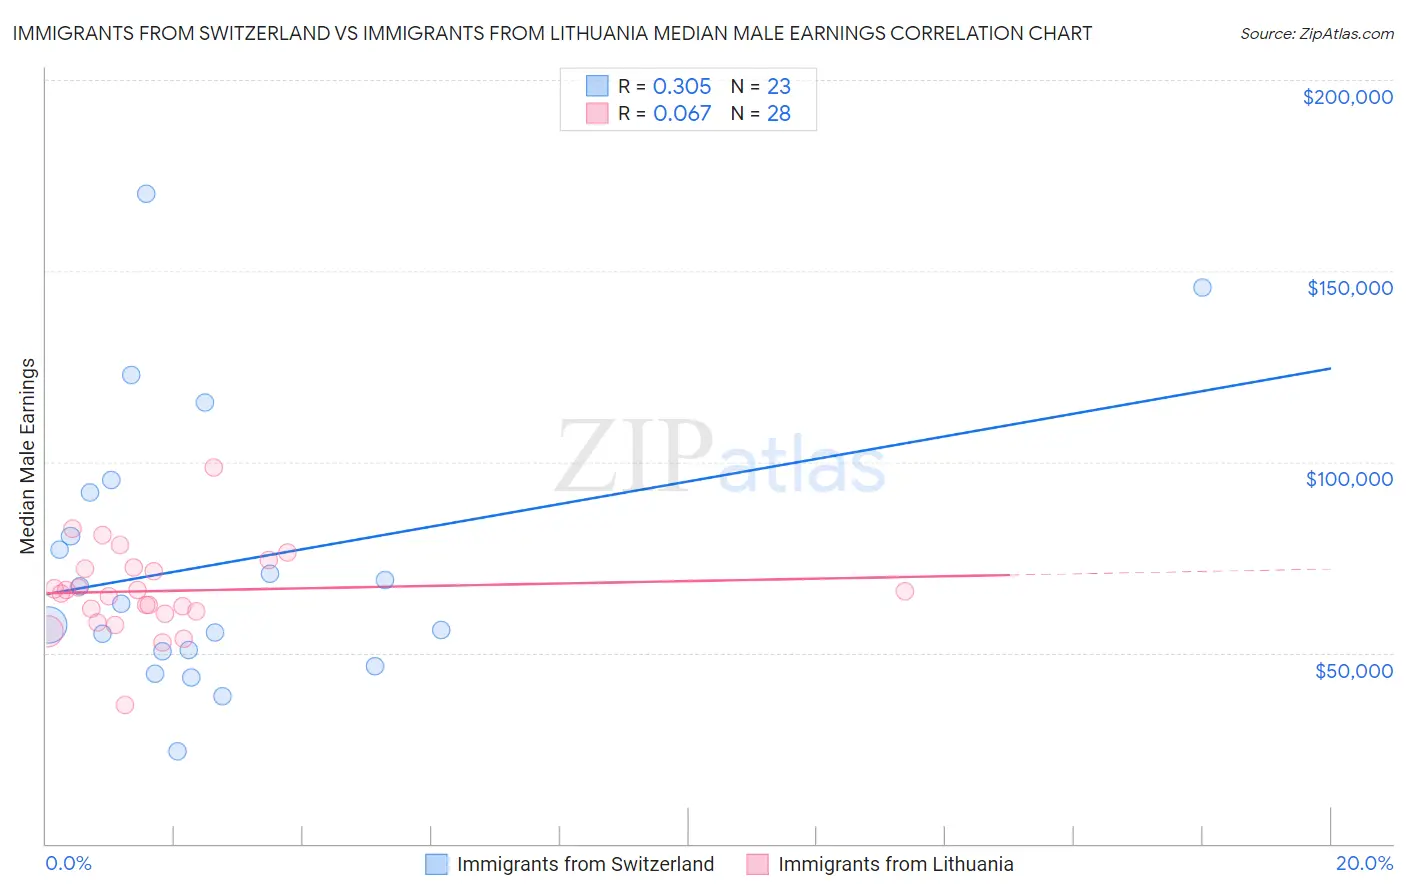
Immigrants from Switzerland vs Immigrants from Lithuania Median Male Earnings Correlation Chart
The statistical analysis conducted on geographies consisting of 148,046,758 people shows a mild positive correlation between the proportion of Immigrants from Switzerland and median male earnings in the United States with a correlation coefficient (R) of 0.305 and weighted average of $63,944. Similarly, the statistical analysis conducted on geographies consisting of 117,720,522 people shows a slight positive correlation between the proportion of Immigrants from Lithuania and median male earnings in the United States with a correlation coefficient (R) of 0.067 and weighted average of $63,346, a difference of 0.95%.
Median Male Earnings Correlation Summary
| Measurement | Immigrants from Switzerland | Immigrants from Lithuania |
| Minimum | $24,152 | $36,313 |
| Maximum | $170,239 | $98,618 |
| Range | $146,087 | $62,305 |
| Mean | $73,519 | $66,192 |
| Median | $62,840 | $65,733 |
| Interquartile 25% (IQ1) | $50,348 | $60,577 |
| Interquartile 75% (IQ3) | $91,948 | $72,153 |
| Interquartile Range (IQR) | $41,600 | $11,576 |
| Standard Deviation (Sample) | $35,831 | $11,479 |
| Standard Deviation (Population) | $35,043 | $11,272 |
Demographics Similar to Immigrants from Switzerland and Immigrants from Lithuania by Median Male Earnings
In terms of median male earnings, the demographic groups most similar to Immigrants from Switzerland are Russian ($63,939, a difference of 0.010%), Asian ($63,827, a difference of 0.18%), Immigrants from France ($63,715, a difference of 0.36%), Turkish ($64,253, a difference of 0.48%), and Latvian ($63,498, a difference of 0.70%). Similarly, the demographic groups most similar to Immigrants from Lithuania are Immigrants from Russia ($63,326, a difference of 0.030%), Soviet Union ($63,382, a difference of 0.060%), Immigrants from Asia ($63,240, a difference of 0.17%), Israeli ($63,228, a difference of 0.19%), and Latvian ($63,498, a difference of 0.24%).
| Demographics | Rating | Rank | Median Male Earnings |
| Immigrants | Japan | 100.0 /100 | #20 | Exceptional $65,518 |
| Immigrants | Sweden | 100.0 /100 | #21 | Exceptional $65,406 |
| Burmese | 100.0 /100 | #22 | Exceptional $65,236 |
| Immigrants | Korea | 100.0 /100 | #23 | Exceptional $65,079 |
| Immigrants | Northern Europe | 100.0 /100 | #24 | Exceptional $64,987 |
| Immigrants | Denmark | 100.0 /100 | #25 | Exceptional $64,625 |
| Turks | 100.0 /100 | #26 | Exceptional $64,253 |
| Immigrants | Switzerland | 100.0 /100 | #27 | Exceptional $63,944 |
| Russians | 100.0 /100 | #28 | Exceptional $63,939 |
| Asians | 100.0 /100 | #29 | Exceptional $63,827 |
| Immigrants | France | 100.0 /100 | #30 | Exceptional $63,715 |
| Latvians | 100.0 /100 | #31 | Exceptional $63,498 |
| Soviet Union | 100.0 /100 | #32 | Exceptional $63,382 |
| Immigrants | Lithuania | 100.0 /100 | #33 | Exceptional $63,346 |
| Immigrants | Russia | 100.0 /100 | #34 | Exceptional $63,326 |
| Immigrants | Asia | 100.0 /100 | #35 | Exceptional $63,240 |
| Israelis | 100.0 /100 | #36 | Exceptional $63,228 |
| Immigrants | Sri Lanka | 100.0 /100 | #37 | Exceptional $63,099 |
| Maltese | 100.0 /100 | #38 | Exceptional $62,953 |
| Immigrants | South Africa | 100.0 /100 | #39 | Exceptional $62,899 |
| Australians | 100.0 /100 | #40 | Exceptional $62,857 |