Immigrants from Switzerland vs Burmese Median Family Income
COMPARE
Immigrants from Switzerland
Burmese
Median Family Income
Median Family Income Comparison
Immigrants from Switzerland
Burmese
$120,726
MEDIAN FAMILY INCOME
100.0/ 100
METRIC RATING
26th/ 347
METRIC RANK
$123,369
MEDIAN FAMILY INCOME
100.0/ 100
METRIC RATING
20th/ 347
METRIC RANK
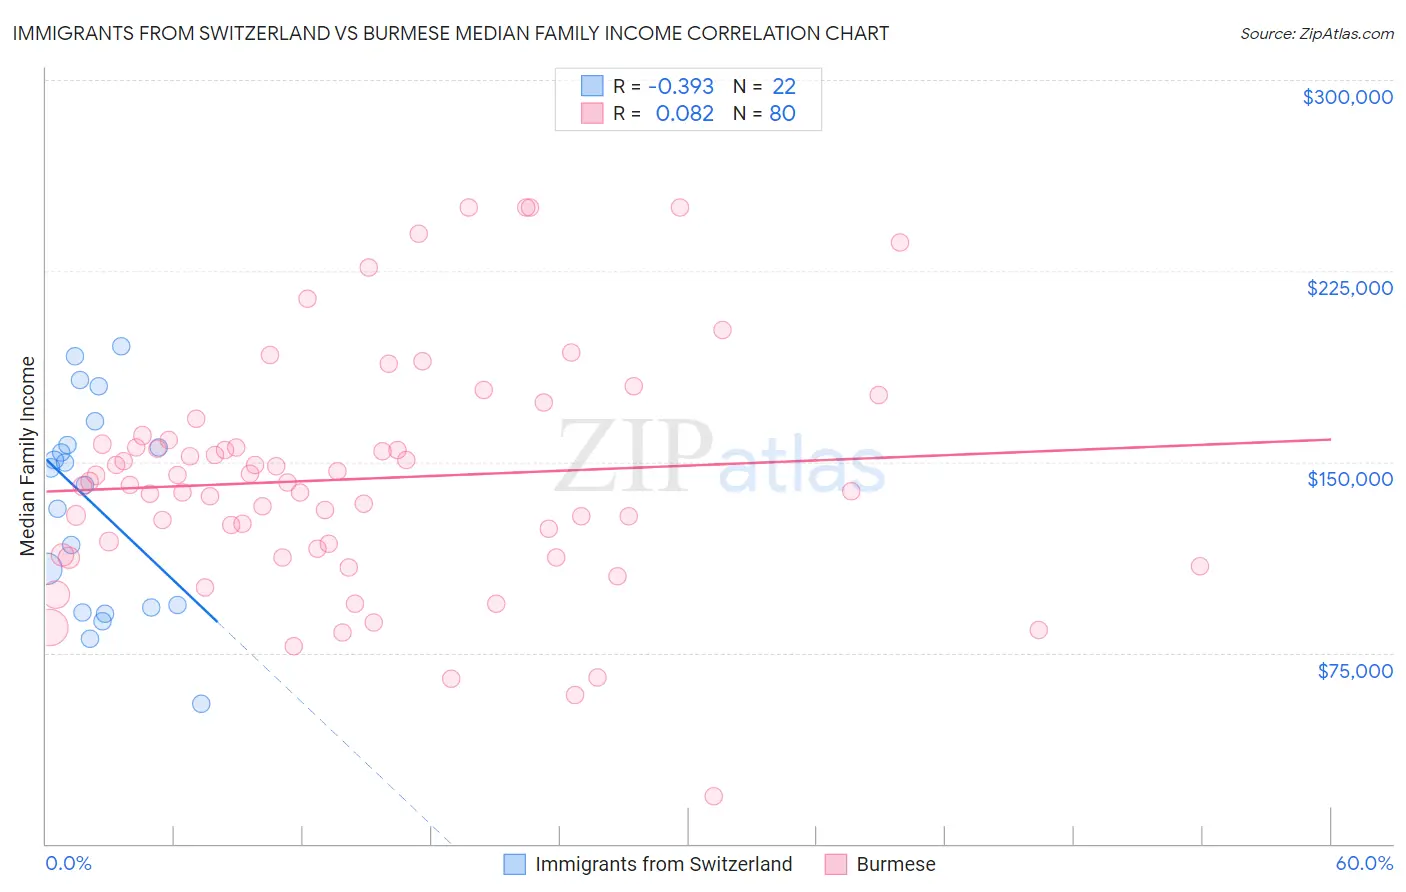
Immigrants from Switzerland vs Burmese Median Family Income Correlation Chart
The statistical analysis conducted on geographies consisting of 148,050,158 people shows a mild negative correlation between the proportion of Immigrants from Switzerland and median family income in the United States with a correlation coefficient (R) of -0.393 and weighted average of $120,726. Similarly, the statistical analysis conducted on geographies consisting of 464,661,736 people shows a slight positive correlation between the proportion of Burmese and median family income in the United States with a correlation coefficient (R) of 0.082 and weighted average of $123,369, a difference of 2.2%.
Median Family Income Correlation Summary
| Measurement | Immigrants from Switzerland | Burmese |
| Minimum | $55,000 | $18,796 |
| Maximum | $195,586 | $250,001 |
| Range | $140,586 | $231,205 |
| Mean | $132,599 | $143,360 |
| Median | $144,292 | $141,361 |
| Interquartile 25% (IQ1) | $92,813 | $114,595 |
| Interquartile 75% (IQ3) | $156,420 | $157,872 |
| Interquartile Range (IQR) | $63,607 | $43,276 |
| Standard Deviation (Sample) | $40,204 | $46,200 |
| Standard Deviation (Population) | $39,280 | $45,911 |
Demographics Similar to Immigrants from Switzerland and Burmese by Median Family Income
In terms of median family income, the demographic groups most similar to Immigrants from Switzerland are Russian ($120,487, a difference of 0.20%), Immigrants from Denmark ($120,445, a difference of 0.23%), Latvian ($120,301, a difference of 0.35%), Turkish ($121,202, a difference of 0.39%), and Immigrants from Sri Lanka ($120,263, a difference of 0.39%). Similarly, the demographic groups most similar to Burmese are Immigrants from Belgium ($123,831, a difference of 0.37%), Immigrants from Korea ($122,800, a difference of 0.46%), Immigrants from Sweden ($122,765, a difference of 0.49%), Immigrants from Japan ($122,764, a difference of 0.49%), and Immigrants from Northern Europe ($121,840, a difference of 1.3%).
| Demographics | Rating | Rank | Median Family Income |
| Immigrants | Australia | 100.0 /100 | #13 | Exceptional $126,620 |
| Immigrants | South Central Asia | 100.0 /100 | #14 | Exceptional $125,956 |
| Eastern Europeans | 100.0 /100 | #15 | Exceptional $125,546 |
| Immigrants | China | 100.0 /100 | #16 | Exceptional $125,540 |
| Indians (Asian) | 100.0 /100 | #17 | Exceptional $125,312 |
| Immigrants | Eastern Asia | 100.0 /100 | #18 | Exceptional $125,150 |
| Immigrants | Belgium | 100.0 /100 | #19 | Exceptional $123,831 |
| Burmese | 100.0 /100 | #20 | Exceptional $123,369 |
| Immigrants | Korea | 100.0 /100 | #21 | Exceptional $122,800 |
| Immigrants | Sweden | 100.0 /100 | #22 | Exceptional $122,765 |
| Immigrants | Japan | 100.0 /100 | #23 | Exceptional $122,764 |
| Immigrants | Northern Europe | 100.0 /100 | #24 | Exceptional $121,840 |
| Turks | 100.0 /100 | #25 | Exceptional $121,202 |
| Immigrants | Switzerland | 100.0 /100 | #26 | Exceptional $120,726 |
| Russians | 100.0 /100 | #27 | Exceptional $120,487 |
| Immigrants | Denmark | 100.0 /100 | #28 | Exceptional $120,445 |
| Latvians | 100.0 /100 | #29 | Exceptional $120,301 |
| Immigrants | Sri Lanka | 100.0 /100 | #30 | Exceptional $120,263 |
| Immigrants | France | 100.0 /100 | #31 | Exceptional $120,076 |
| Asians | 100.0 /100 | #32 | Exceptional $119,955 |
| Bhutanese | 100.0 /100 | #33 | Exceptional $119,800 |