Immigrants from Sweden vs Immigrants from Taiwan Median Family Income
COMPARE
Immigrants from Sweden
Immigrants from Taiwan
Median Family Income
Median Family Income Comparison
Immigrants from Sweden
Immigrants from Taiwan
$122,765
MEDIAN FAMILY INCOME
100.0/ 100
METRIC RATING
22nd/ 347
METRIC RANK
$136,949
MEDIAN FAMILY INCOME
100.0/ 100
METRIC RATING
2nd/ 347
METRIC RANK
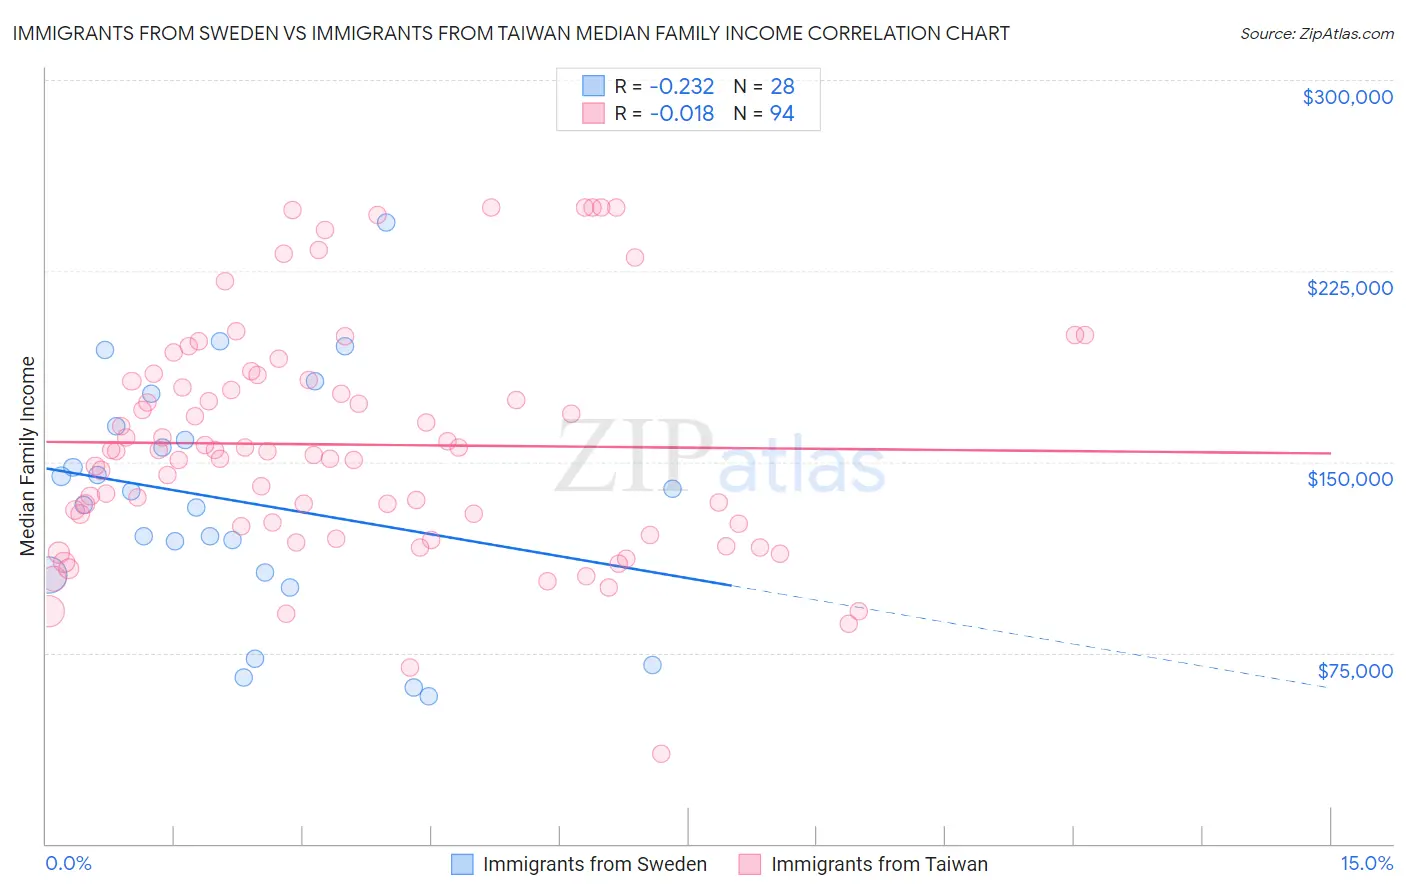
Immigrants from Sweden vs Immigrants from Taiwan Median Family Income Correlation Chart
The statistical analysis conducted on geographies consisting of 164,691,599 people shows a weak negative correlation between the proportion of Immigrants from Sweden and median family income in the United States with a correlation coefficient (R) of -0.232 and weighted average of $122,765. Similarly, the statistical analysis conducted on geographies consisting of 298,070,874 people shows no correlation between the proportion of Immigrants from Taiwan and median family income in the United States with a correlation coefficient (R) of -0.018 and weighted average of $136,949, a difference of 11.6%.
Median Family Income Correlation Summary
| Measurement | Immigrants from Sweden | Immigrants from Taiwan |
| Minimum | $57,930 | $35,382 |
| Maximum | $244,028 | $250,001 |
| Range | $186,098 | $214,619 |
| Mean | $134,549 | $156,781 |
| Median | $135,850 | $154,299 |
| Interquartile 25% (IQ1) | $105,866 | $124,773 |
| Interquartile 75% (IQ3) | $161,266 | $182,305 |
| Interquartile Range (IQR) | $55,400 | $57,532 |
| Standard Deviation (Sample) | $46,012 | $45,464 |
| Standard Deviation (Population) | $45,183 | $45,222 |
Demographics Similar to Immigrants from Sweden and Immigrants from Taiwan by Median Family Income
In terms of median family income, the demographic groups most similar to Immigrants from Sweden are Immigrants from Korea ($122,800, a difference of 0.030%), Burmese ($123,369, a difference of 0.49%), Immigrants from Belgium ($123,831, a difference of 0.87%), Immigrants from Eastern Asia ($125,150, a difference of 1.9%), and Indian (Asian) ($125,312, a difference of 2.1%). Similarly, the demographic groups most similar to Immigrants from Taiwan are Immigrants from Singapore ($134,818, a difference of 1.6%), Immigrants from India ($134,028, a difference of 2.2%), Iranian ($133,839, a difference of 2.3%), Thai ($131,281, a difference of 4.3%), and Immigrants from Hong Kong ($131,067, a difference of 4.5%).
| Demographics | Rating | Rank | Median Family Income |
| Immigrants | Taiwan | 100.0 /100 | #2 | Exceptional $136,949 |
| Immigrants | Singapore | 100.0 /100 | #3 | Exceptional $134,818 |
| Immigrants | India | 100.0 /100 | #4 | Exceptional $134,028 |
| Iranians | 100.0 /100 | #5 | Exceptional $133,839 |
| Thais | 100.0 /100 | #6 | Exceptional $131,281 |
| Immigrants | Hong Kong | 100.0 /100 | #7 | Exceptional $131,067 |
| Immigrants | Iran | 100.0 /100 | #8 | Exceptional $130,894 |
| Okinawans | 100.0 /100 | #9 | Exceptional $129,979 |
| Immigrants | Ireland | 100.0 /100 | #10 | Exceptional $127,584 |
| Immigrants | Israel | 100.0 /100 | #11 | Exceptional $127,430 |
| Cypriots | 100.0 /100 | #12 | Exceptional $127,064 |
| Immigrants | Australia | 100.0 /100 | #13 | Exceptional $126,620 |
| Immigrants | South Central Asia | 100.0 /100 | #14 | Exceptional $125,956 |
| Eastern Europeans | 100.0 /100 | #15 | Exceptional $125,546 |
| Immigrants | China | 100.0 /100 | #16 | Exceptional $125,540 |
| Indians (Asian) | 100.0 /100 | #17 | Exceptional $125,312 |
| Immigrants | Eastern Asia | 100.0 /100 | #18 | Exceptional $125,150 |
| Immigrants | Belgium | 100.0 /100 | #19 | Exceptional $123,831 |
| Burmese | 100.0 /100 | #20 | Exceptional $123,369 |
| Immigrants | Korea | 100.0 /100 | #21 | Exceptional $122,800 |
| Immigrants | Sweden | 100.0 /100 | #22 | Exceptional $122,765 |