Immigrants from St. Vincent and the Grenadines vs Immigrants from North America Median Female Earnings
COMPARE
Immigrants from St. Vincent and the Grenadines
Immigrants from North America
Median Female Earnings
Median Female Earnings Comparison
Immigrants from St. Vincent and the Grenadines
Immigrants from North America
$42,108
MEDIAN FEMALE EARNINGS
99.3/ 100
METRIC RATING
86th/ 347
METRIC RANK
$41,319
MEDIAN FEMALE EARNINGS
96.7/ 100
METRIC RATING
112th/ 347
METRIC RANK
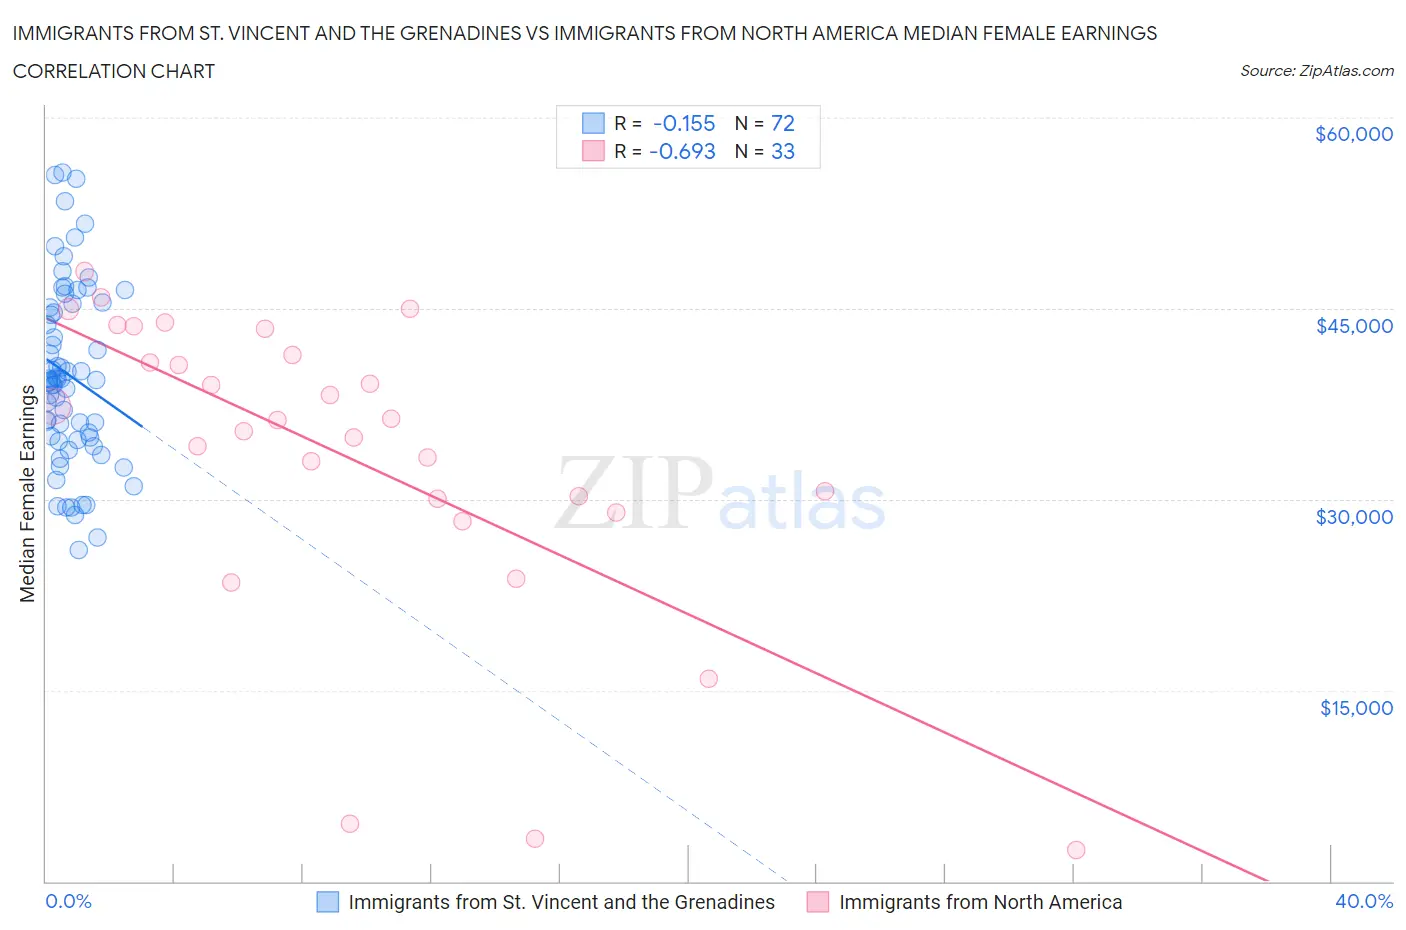
Immigrants from St. Vincent and the Grenadines vs Immigrants from North America Median Female Earnings Correlation Chart
The statistical analysis conducted on geographies consisting of 56,186,609 people shows a poor negative correlation between the proportion of Immigrants from St. Vincent and the Grenadines and median female earnings in the United States with a correlation coefficient (R) of -0.155 and weighted average of $42,108. Similarly, the statistical analysis conducted on geographies consisting of 462,086,595 people shows a significant negative correlation between the proportion of Immigrants from North America and median female earnings in the United States with a correlation coefficient (R) of -0.693 and weighted average of $41,319, a difference of 1.9%.
Median Female Earnings Correlation Summary
| Measurement | Immigrants from St. Vincent and the Grenadines | Immigrants from North America |
| Minimum | $26,069 | $2,499 |
| Maximum | $55,714 | $47,877 |
| Range | $29,645 | $45,378 |
| Mean | $39,753 | $33,312 |
| Median | $39,381 | $36,283 |
| Interquartile 25% (IQ1) | $34,722 | $29,495 |
| Interquartile 75% (IQ3) | $45,227 | $42,384 |
| Interquartile Range (IQR) | $10,505 | $12,888 |
| Standard Deviation (Sample) | $7,078 | $12,008 |
| Standard Deviation (Population) | $7,029 | $11,825 |
Similar Demographics by Median Female Earnings
Demographics Similar to Immigrants from St. Vincent and the Grenadines by Median Female Earnings
In terms of median female earnings, the demographic groups most similar to Immigrants from St. Vincent and the Grenadines are Lithuanian ($42,108, a difference of 0.0%), Laotian ($42,133, a difference of 0.060%), Immigrants from Northern Africa ($42,084, a difference of 0.060%), Immigrants from Afghanistan ($42,055, a difference of 0.13%), and Ukrainian ($42,015, a difference of 0.22%).
| Demographics | Rating | Rank | Median Female Earnings |
| Greeks | 99.6 /100 | #79 | Exceptional $42,336 |
| Immigrants | Moldova | 99.6 /100 | #80 | Exceptional $42,304 |
| Immigrants | Southern Europe | 99.5 /100 | #81 | Exceptional $42,275 |
| Immigrants | Morocco | 99.5 /100 | #82 | Exceptional $42,229 |
| Immigrants | Sierra Leone | 99.5 /100 | #83 | Exceptional $42,214 |
| Armenians | 99.5 /100 | #84 | Exceptional $42,212 |
| Laotians | 99.4 /100 | #85 | Exceptional $42,133 |
| Immigrants | St. Vincent and the Grenadines | 99.3 /100 | #86 | Exceptional $42,108 |
| Lithuanians | 99.3 /100 | #87 | Exceptional $42,108 |
| Immigrants | Northern Africa | 99.3 /100 | #88 | Exceptional $42,084 |
| Immigrants | Afghanistan | 99.3 /100 | #89 | Exceptional $42,055 |
| Ukrainians | 99.2 /100 | #90 | Exceptional $42,015 |
| Immigrants | Western Europe | 99.2 /100 | #91 | Exceptional $41,990 |
| Argentineans | 99.1 /100 | #92 | Exceptional $41,952 |
| Immigrants | Grenada | 99.0 /100 | #93 | Exceptional $41,932 |
Demographics Similar to Immigrants from North America by Median Female Earnings
In terms of median female earnings, the demographic groups most similar to Immigrants from North America are Macedonian ($41,286, a difference of 0.080%), Immigrants from England ($41,277, a difference of 0.10%), Korean ($41,276, a difference of 0.10%), Immigrants from Brazil ($41,273, a difference of 0.11%), and Immigrants from Canada ($41,373, a difference of 0.13%).
| Demographics | Rating | Rank | Median Female Earnings |
| Italians | 97.7 /100 | #105 | Exceptional $41,505 |
| Immigrants | Eritrea | 97.6 /100 | #106 | Exceptional $41,485 |
| Palestinians | 97.6 /100 | #107 | Exceptional $41,484 |
| Jordanians | 97.5 /100 | #108 | Exceptional $41,464 |
| Chinese | 97.5 /100 | #109 | Exceptional $41,461 |
| Immigrants | Western Asia | 97.0 /100 | #110 | Exceptional $41,375 |
| Immigrants | Canada | 97.0 /100 | #111 | Exceptional $41,373 |
| Immigrants | North America | 96.7 /100 | #112 | Exceptional $41,319 |
| Macedonians | 96.4 /100 | #113 | Exceptional $41,286 |
| Immigrants | England | 96.4 /100 | #114 | Exceptional $41,277 |
| Koreans | 96.4 /100 | #115 | Exceptional $41,276 |
| Immigrants | Brazil | 96.4 /100 | #116 | Exceptional $41,273 |
| Barbadians | 96.3 /100 | #117 | Exceptional $41,261 |
| Immigrants | Lebanon | 95.6 /100 | #118 | Exceptional $41,183 |
| Immigrants | Philippines | 95.0 /100 | #119 | Exceptional $41,114 |