Immigrants from St. Vincent and the Grenadines vs Immigrants from Brazil Householder Income Under 25 years
COMPARE
Immigrants from St. Vincent and the Grenadines
Immigrants from Brazil
Householder Income Under 25 years
Householder Income Under 25 years Comparison
Immigrants from St. Vincent and the Grenadines
Immigrants from Brazil
$54,230
HOUSEHOLDER INCOME UNDER 25 YEARS
99.3/ 100
METRIC RATING
92nd/ 347
METRIC RANK
$54,487
HOUSEHOLDER INCOME UNDER 25 YEARS
99.6/ 100
METRIC RATING
76th/ 347
METRIC RANK
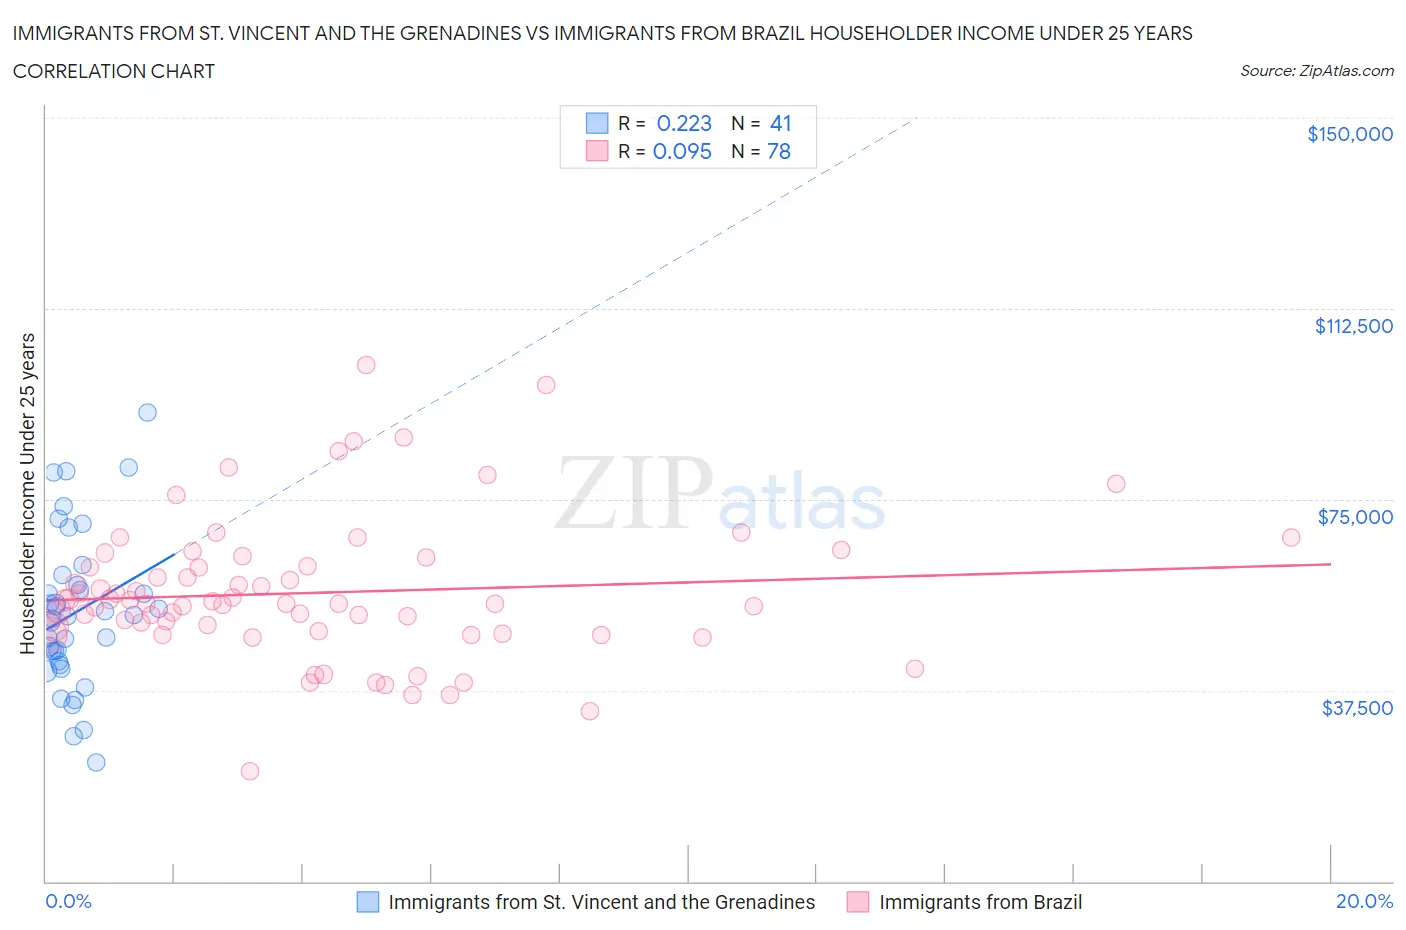
Immigrants from St. Vincent and the Grenadines vs Immigrants from Brazil Householder Income Under 25 years Correlation Chart
The statistical analysis conducted on geographies consisting of 51,601,102 people shows a weak positive correlation between the proportion of Immigrants from St. Vincent and the Grenadines and household income with householder under the age of 25 in the United States with a correlation coefficient (R) of 0.223 and weighted average of $54,230. Similarly, the statistical analysis conducted on geographies consisting of 290,809,322 people shows a slight positive correlation between the proportion of Immigrants from Brazil and household income with householder under the age of 25 in the United States with a correlation coefficient (R) of 0.095 and weighted average of $54,487, a difference of 0.47%.
Householder Income Under 25 years Correlation Summary
| Measurement | Immigrants from St. Vincent and the Grenadines | Immigrants from Brazil |
| Minimum | $23,250 | $21,618 |
| Maximum | $92,155 | $101,440 |
| Range | $68,905 | $79,822 |
| Mean | $52,801 | $56,652 |
| Median | $52,122 | $54,576 |
| Interquartile 25% (IQ1) | $42,812 | $49,112 |
| Interquartile 75% (IQ3) | $59,173 | $61,875 |
| Interquartile Range (IQR) | $16,362 | $12,763 |
| Standard Deviation (Sample) | $15,284 | $13,948 |
| Standard Deviation (Population) | $15,096 | $13,859 |
Demographics Similar to Immigrants from St. Vincent and the Grenadines and Immigrants from Brazil by Householder Income Under 25 years
In terms of householder income under 25 years, the demographic groups most similar to Immigrants from St. Vincent and the Grenadines are Immigrants from Egypt ($54,239, a difference of 0.020%), Immigrants from Argentina ($54,209, a difference of 0.040%), Immigrants from South America ($54,268, a difference of 0.070%), Turkish ($54,266, a difference of 0.070%), and Immigrants from Sierra Leone ($54,190, a difference of 0.070%). Similarly, the demographic groups most similar to Immigrants from Brazil are Immigrants from Southern Europe ($54,484, a difference of 0.010%), Nepalese ($54,472, a difference of 0.030%), Immigrants from Sri Lanka ($54,512, a difference of 0.050%), Immigrants from Italy ($54,449, a difference of 0.070%), and Egyptian ($54,444, a difference of 0.080%).
| Demographics | Rating | Rank | Householder Income Under 25 years |
| Immigrants | Grenada | 99.7 /100 | #74 | Exceptional $54,538 |
| Immigrants | Sri Lanka | 99.7 /100 | #75 | Exceptional $54,512 |
| Immigrants | Brazil | 99.6 /100 | #76 | Exceptional $54,487 |
| Immigrants | Southern Europe | 99.6 /100 | #77 | Exceptional $54,484 |
| Nepalese | 99.6 /100 | #78 | Exceptional $54,472 |
| Immigrants | Italy | 99.6 /100 | #79 | Exceptional $54,449 |
| Egyptians | 99.6 /100 | #80 | Exceptional $54,444 |
| Portuguese | 99.6 /100 | #81 | Exceptional $54,436 |
| Russians | 99.5 /100 | #82 | Exceptional $54,389 |
| Laotians | 99.5 /100 | #83 | Exceptional $54,369 |
| Bulgarians | 99.5 /100 | #84 | Exceptional $54,352 |
| Immigrants | Czechoslovakia | 99.5 /100 | #85 | Exceptional $54,352 |
| Immigrants | Croatia | 99.5 /100 | #86 | Exceptional $54,343 |
| Brazilians | 99.5 /100 | #87 | Exceptional $54,335 |
| Yakama | 99.5 /100 | #88 | Exceptional $54,321 |
| Immigrants | South America | 99.4 /100 | #89 | Exceptional $54,268 |
| Turks | 99.4 /100 | #90 | Exceptional $54,266 |
| Immigrants | Egypt | 99.3 /100 | #91 | Exceptional $54,239 |
| Immigrants | St. Vincent and the Grenadines | 99.3 /100 | #92 | Exceptional $54,230 |
| Immigrants | Argentina | 99.3 /100 | #93 | Exceptional $54,209 |
| Immigrants | Sierra Leone | 99.3 /100 | #94 | Exceptional $54,190 |