Immigrants from Southern Europe vs Croatian Median Earnings
COMPARE
Immigrants from Southern Europe
Croatian
Median Earnings
Median Earnings Comparison
Immigrants from Southern Europe
Croatians
$50,280
MEDIAN EARNINGS
99.6/ 100
METRIC RATING
81st/ 347
METRIC RANK
$49,724
MEDIAN EARNINGS
99.0/ 100
METRIC RATING
94th/ 347
METRIC RANK
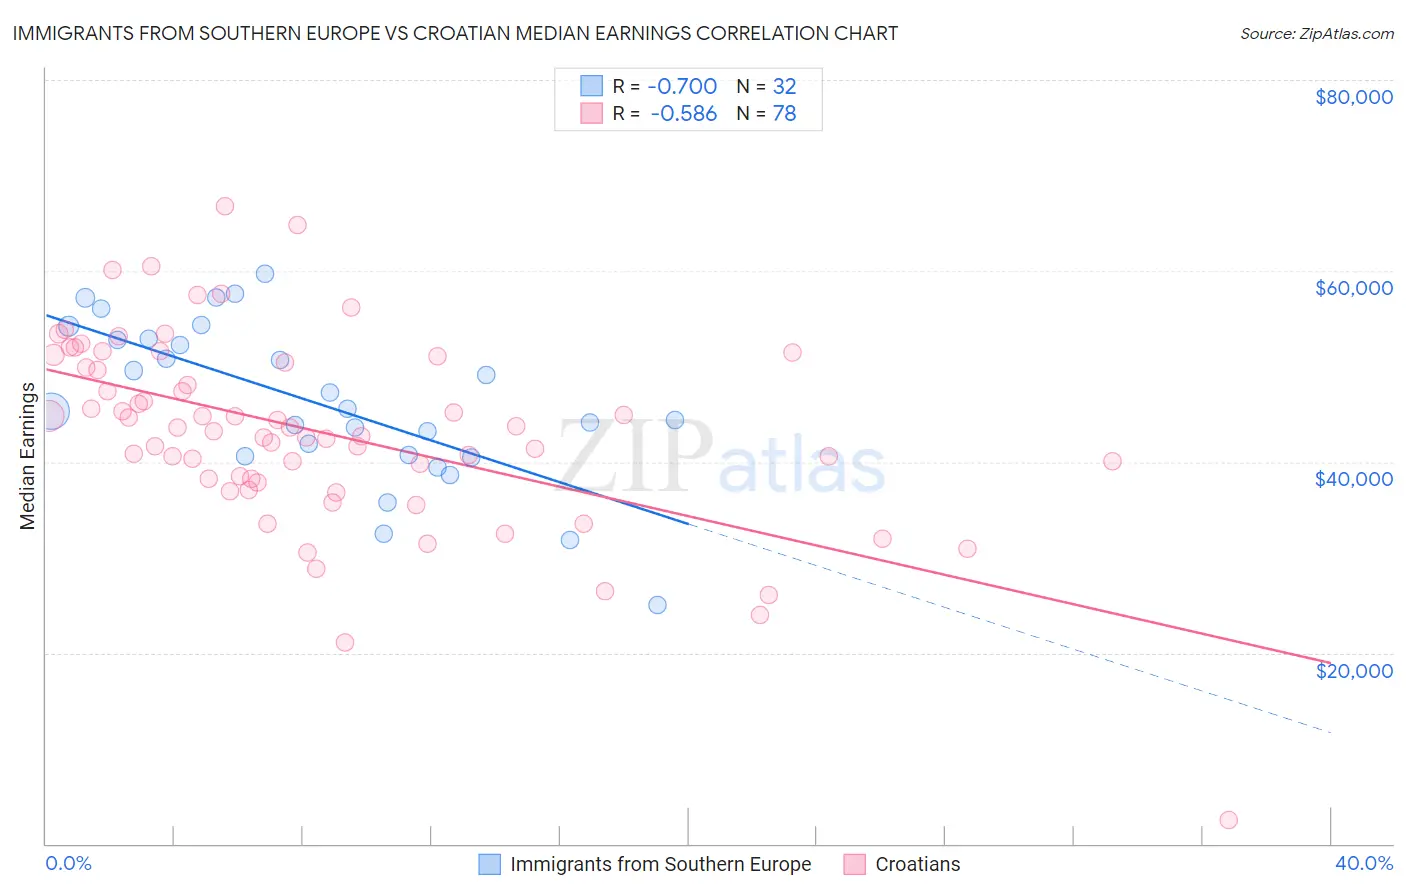
Immigrants from Southern Europe vs Croatian Median Earnings Correlation Chart
The statistical analysis conducted on geographies consisting of 402,763,457 people shows a significant negative correlation between the proportion of Immigrants from Southern Europe and median earnings in the United States with a correlation coefficient (R) of -0.700 and weighted average of $50,280. Similarly, the statistical analysis conducted on geographies consisting of 375,721,737 people shows a substantial negative correlation between the proportion of Croatians and median earnings in the United States with a correlation coefficient (R) of -0.586 and weighted average of $49,724, a difference of 1.1%.
Median Earnings Correlation Summary
| Measurement | Immigrants from Southern Europe | Croatian |
| Minimum | $25,046 | $2,499 |
| Maximum | $59,687 | $66,786 |
| Range | $34,641 | $64,287 |
| Mean | $46,213 | $43,106 |
| Median | $45,445 | $43,408 |
| Interquartile 25% (IQ1) | $40,648 | $38,221 |
| Interquartile 75% (IQ3) | $52,864 | $50,378 |
| Interquartile Range (IQR) | $12,216 | $12,158 |
| Standard Deviation (Sample) | $8,358 | $10,203 |
| Standard Deviation (Population) | $8,227 | $10,137 |
Demographics Similar to Immigrants from Southern Europe and Croatians by Median Earnings
In terms of median earnings, the demographic groups most similar to Immigrants from Southern Europe are Immigrants from Moldova ($50,274, a difference of 0.010%), Romanian ($50,244, a difference of 0.070%), Ukrainian ($50,320, a difference of 0.080%), Immigrants from Hungary ($50,227, a difference of 0.11%), and Immigrants from Kazakhstan ($50,225, a difference of 0.11%). Similarly, the demographic groups most similar to Croatians are Immigrants from England ($49,722, a difference of 0.0%), Immigrants from Lebanon ($49,682, a difference of 0.090%), Immigrants from North Macedonia ($49,658, a difference of 0.13%), Armenian ($49,804, a difference of 0.16%), and Immigrants from Argentina ($49,841, a difference of 0.23%).
| Demographics | Rating | Rank | Median Earnings |
| Immigrants | Western Europe | 99.7 /100 | #77 | Exceptional $50,549 |
| Argentineans | 99.6 /100 | #78 | Exceptional $50,399 |
| Laotians | 99.6 /100 | #79 | Exceptional $50,343 |
| Ukrainians | 99.6 /100 | #80 | Exceptional $50,320 |
| Immigrants | Southern Europe | 99.6 /100 | #81 | Exceptional $50,280 |
| Immigrants | Moldova | 99.5 /100 | #82 | Exceptional $50,274 |
| Romanians | 99.5 /100 | #83 | Exceptional $50,244 |
| Immigrants | Hungary | 99.5 /100 | #84 | Exceptional $50,227 |
| Immigrants | Kazakhstan | 99.5 /100 | #85 | Exceptional $50,225 |
| Immigrants | Canada | 99.5 /100 | #86 | Exceptional $50,192 |
| Immigrants | Uzbekistan | 99.5 /100 | #87 | Exceptional $50,151 |
| Albanians | 99.4 /100 | #88 | Exceptional $50,116 |
| Immigrants | North America | 99.4 /100 | #89 | Exceptional $50,108 |
| Italians | 99.3 /100 | #90 | Exceptional $49,915 |
| Macedonians | 99.2 /100 | #91 | Exceptional $49,893 |
| Immigrants | Argentina | 99.2 /100 | #92 | Exceptional $49,841 |
| Armenians | 99.1 /100 | #93 | Exceptional $49,804 |
| Croatians | 99.0 /100 | #94 | Exceptional $49,724 |
| Immigrants | England | 99.0 /100 | #95 | Exceptional $49,722 |
| Immigrants | Lebanon | 99.0 /100 | #96 | Exceptional $49,682 |
| Immigrants | North Macedonia | 98.9 /100 | #97 | Exceptional $49,658 |