Immigrants from South Eastern Asia vs Lebanese Householder Income Under 25 years
COMPARE
Immigrants from South Eastern Asia
Lebanese
Householder Income Under 25 years
Householder Income Under 25 years Comparison
Immigrants from South Eastern Asia
Lebanese
$55,714
HOUSEHOLDER INCOME UNDER 25 YEARS
100.0/ 100
METRIC RATING
43rd/ 347
METRIC RANK
$50,355
HOUSEHOLDER INCOME UNDER 25 YEARS
1.1/ 100
METRIC RATING
257th/ 347
METRIC RANK
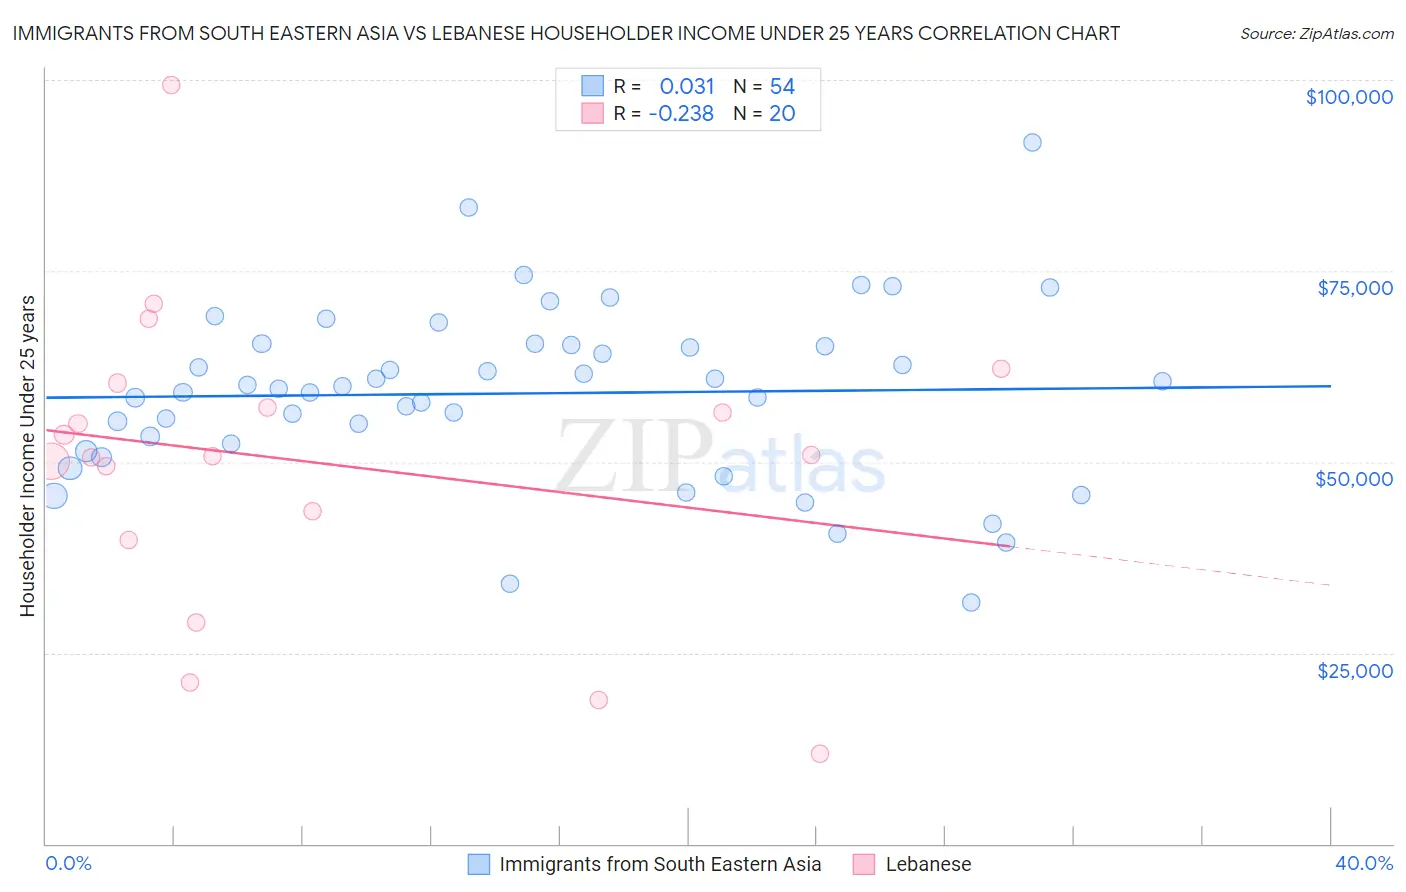
Immigrants from South Eastern Asia vs Lebanese Householder Income Under 25 years Correlation Chart
The statistical analysis conducted on geographies consisting of 413,516,048 people shows no correlation between the proportion of Immigrants from South Eastern Asia and household income with householder under the age of 25 in the United States with a correlation coefficient (R) of 0.031 and weighted average of $55,714. Similarly, the statistical analysis conducted on geographies consisting of 337,299,986 people shows a weak negative correlation between the proportion of Lebanese and household income with householder under the age of 25 in the United States with a correlation coefficient (R) of -0.238 and weighted average of $50,355, a difference of 10.6%.
Householder Income Under 25 years Correlation Summary
| Measurement | Immigrants from South Eastern Asia | Lebanese |
| Minimum | $31,667 | $11,835 |
| Maximum | $91,771 | $99,421 |
| Range | $60,104 | $87,586 |
| Mean | $58,961 | $49,958 |
| Median | $59,717 | $50,777 |
| Interquartile 25% (IQ1) | $52,347 | $41,651 |
| Interquartile 75% (IQ3) | $65,355 | $58,726 |
| Interquartile Range (IQR) | $13,008 | $17,075 |
| Standard Deviation (Sample) | $11,452 | $19,834 |
| Standard Deviation (Population) | $11,346 | $19,332 |
Similar Demographics by Householder Income Under 25 years
Demographics Similar to Immigrants from South Eastern Asia by Householder Income Under 25 years
In terms of householder income under 25 years, the demographic groups most similar to Immigrants from South Eastern Asia are Immigrants from Korea ($55,716, a difference of 0.0%), Immigrants from Greece ($55,727, a difference of 0.020%), Immigrants from Guyana ($55,726, a difference of 0.020%), Immigrants from Belarus ($55,743, a difference of 0.050%), and Paraguayan ($55,614, a difference of 0.18%).
| Demographics | Rating | Rank | Householder Income Under 25 years |
| Immigrants | Israel | 100.0 /100 | #36 | Exceptional $55,913 |
| Immigrants | Russia | 100.0 /100 | #37 | Exceptional $55,891 |
| Immigrants | Iran | 100.0 /100 | #38 | Exceptional $55,880 |
| Immigrants | Belarus | 100.0 /100 | #39 | Exceptional $55,743 |
| Immigrants | Greece | 100.0 /100 | #40 | Exceptional $55,727 |
| Immigrants | Guyana | 100.0 /100 | #41 | Exceptional $55,726 |
| Immigrants | Korea | 100.0 /100 | #42 | Exceptional $55,716 |
| Immigrants | South Eastern Asia | 100.0 /100 | #43 | Exceptional $55,714 |
| Paraguayans | 100.0 /100 | #44 | Exceptional $55,614 |
| Spanish American Indians | 100.0 /100 | #45 | Exceptional $55,573 |
| Immigrants | Eastern Europe | 100.0 /100 | #46 | Exceptional $55,572 |
| Cambodians | 100.0 /100 | #47 | Exceptional $55,571 |
| Immigrants | Vietnam | 100.0 /100 | #48 | Exceptional $55,562 |
| Iranians | 100.0 /100 | #49 | Exceptional $55,548 |
| Puget Sound Salish | 100.0 /100 | #50 | Exceptional $55,543 |
Demographics Similar to Lebanese by Householder Income Under 25 years
In terms of householder income under 25 years, the demographic groups most similar to Lebanese are Aleut ($50,377, a difference of 0.040%), Immigrants from Cuba ($50,374, a difference of 0.040%), White/Caucasian ($50,336, a difference of 0.040%), Luxembourger ($50,379, a difference of 0.050%), and Immigrants from Haiti ($50,398, a difference of 0.090%).
| Demographics | Rating | Rank | Householder Income Under 25 years |
| Immigrants | Cabo Verde | 1.7 /100 | #250 | Tragic $50,520 |
| Celtics | 1.4 /100 | #251 | Tragic $50,447 |
| Immigrants | Mexico | 1.3 /100 | #252 | Tragic $50,422 |
| Immigrants | Haiti | 1.2 /100 | #253 | Tragic $50,398 |
| Luxembourgers | 1.2 /100 | #254 | Tragic $50,379 |
| Aleuts | 1.2 /100 | #255 | Tragic $50,377 |
| Immigrants | Cuba | 1.2 /100 | #256 | Tragic $50,374 |
| Lebanese | 1.1 /100 | #257 | Tragic $50,355 |
| Whites/Caucasians | 1.1 /100 | #258 | Tragic $50,336 |
| Immigrants | Dominica | 1.0 /100 | #259 | Tragic $50,301 |
| Hispanics or Latinos | 0.9 /100 | #260 | Tragic $50,279 |
| Hungarians | 0.9 /100 | #261 | Tragic $50,247 |
| Haitians | 0.8 /100 | #262 | Tragic $50,231 |
| Immigrants | Dominican Republic | 0.8 /100 | #263 | Tragic $50,204 |
| Fijians | 0.6 /100 | #264 | Tragic $50,132 |