Immigrants from South Central Asia vs Belizean Median Household Income
COMPARE
Immigrants from South Central Asia
Belizean
Median Household Income
Median Household Income Comparison
Immigrants from South Central Asia
Belizeans
$106,057
MEDIAN HOUSEHOLD INCOME
100.0/ 100
METRIC RATING
10th/ 347
METRIC RANK
$77,028
MEDIAN HOUSEHOLD INCOME
0.6/ 100
METRIC RATING
256th/ 347
METRIC RANK
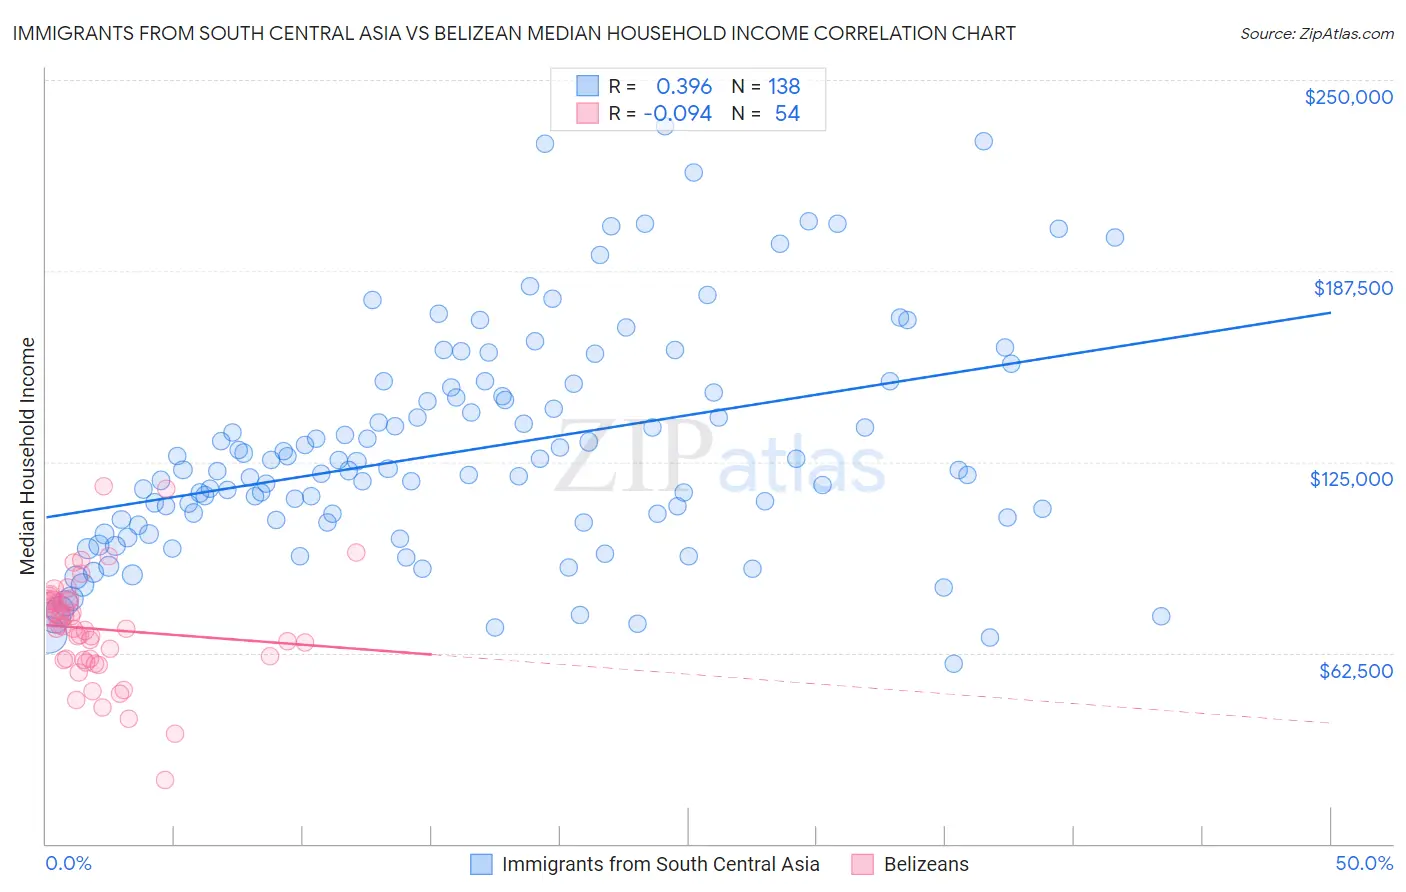
Immigrants from South Central Asia vs Belizean Median Household Income Correlation Chart
The statistical analysis conducted on geographies consisting of 472,541,565 people shows a mild positive correlation between the proportion of Immigrants from South Central Asia and median household income in the United States with a correlation coefficient (R) of 0.396 and weighted average of $106,057. Similarly, the statistical analysis conducted on geographies consisting of 144,146,880 people shows a slight negative correlation between the proportion of Belizeans and median household income in the United States with a correlation coefficient (R) of -0.094 and weighted average of $77,028, a difference of 37.7%.
Median Household Income Correlation Summary
| Measurement | Immigrants from South Central Asia | Belizean |
| Minimum | $58,750 | $20,723 |
| Maximum | $234,750 | $117,113 |
| Range | $176,000 | $96,390 |
| Mean | $128,797 | $70,224 |
| Median | $122,210 | $70,434 |
| Interquartile 25% (IQ1) | $105,243 | $60,138 |
| Interquartile 75% (IQ3) | $147,699 | $79,527 |
| Interquartile Range (IQR) | $42,456 | $19,389 |
| Standard Deviation (Sample) | $36,764 | $17,495 |
| Standard Deviation (Population) | $36,630 | $17,332 |
Similar Demographics by Median Household Income
Demographics Similar to Immigrants from South Central Asia by Median Household Income
In terms of median household income, the demographic groups most similar to Immigrants from South Central Asia are Okinawan ($106,624, a difference of 0.53%), Immigrants from China ($105,335, a difference of 0.69%), Indian (Asian) ($105,262, a difference of 0.76%), Immigrants from Eastern Asia ($104,796, a difference of 1.2%), and Immigrants from Ireland ($104,692, a difference of 1.3%).
| Demographics | Rating | Rank | Median Household Income |
| Immigrants | India | 100.0 /100 | #3 | Exceptional $113,009 |
| Immigrants | Hong Kong | 100.0 /100 | #4 | Exceptional $111,519 |
| Thais | 100.0 /100 | #5 | Exceptional $110,648 |
| Immigrants | Singapore | 100.0 /100 | #6 | Exceptional $110,428 |
| Iranians | 100.0 /100 | #7 | Exceptional $109,835 |
| Immigrants | Iran | 100.0 /100 | #8 | Exceptional $108,055 |
| Okinawans | 100.0 /100 | #9 | Exceptional $106,624 |
| Immigrants | South Central Asia | 100.0 /100 | #10 | Exceptional $106,057 |
| Immigrants | China | 100.0 /100 | #11 | Exceptional $105,335 |
| Indians (Asian) | 100.0 /100 | #12 | Exceptional $105,262 |
| Immigrants | Eastern Asia | 100.0 /100 | #13 | Exceptional $104,796 |
| Immigrants | Ireland | 100.0 /100 | #14 | Exceptional $104,692 |
| Immigrants | Israel | 100.0 /100 | #15 | Exceptional $104,090 |
| Burmese | 100.0 /100 | #16 | Exceptional $103,145 |
| Immigrants | Korea | 100.0 /100 | #17 | Exceptional $102,962 |
Demographics Similar to Belizeans by Median Household Income
In terms of median household income, the demographic groups most similar to Belizeans are Immigrants from Senegal ($76,915, a difference of 0.15%), Immigrants from Nicaragua ($76,784, a difference of 0.32%), Spanish American Indian ($76,670, a difference of 0.47%), Jamaican ($76,583, a difference of 0.58%), and Immigrants from Grenada ($76,517, a difference of 0.67%).
| Demographics | Rating | Rank | Median Household Income |
| West Indians | 1.4 /100 | #249 | Tragic $78,455 |
| Immigrants | Laos | 1.3 /100 | #250 | Tragic $78,327 |
| Mexican American Indians | 1.2 /100 | #251 | Tragic $78,166 |
| Immigrants | West Indies | 1.0 /100 | #252 | Tragic $77,956 |
| Immigrants | St. Vincent and the Grenadines | 0.9 /100 | #253 | Tragic $77,690 |
| Sub-Saharan Africans | 0.8 /100 | #254 | Tragic $77,631 |
| Immigrants | Middle Africa | 0.8 /100 | #255 | Tragic $77,559 |
| Belizeans | 0.6 /100 | #256 | Tragic $77,028 |
| Immigrants | Senegal | 0.5 /100 | #257 | Tragic $76,915 |
| Immigrants | Nicaragua | 0.5 /100 | #258 | Tragic $76,784 |
| Spanish American Indians | 0.4 /100 | #259 | Tragic $76,670 |
| Jamaicans | 0.4 /100 | #260 | Tragic $76,583 |
| Immigrants | Grenada | 0.4 /100 | #261 | Tragic $76,517 |
| French American Indians | 0.4 /100 | #262 | Tragic $76,387 |
| Alaskan Athabascans | 0.4 /100 | #263 | Tragic $76,383 |