Immigrants from South America vs Paraguayan Median Household Income
COMPARE
Immigrants from South America
Paraguayan
Median Household Income
Median Household Income Comparison
Immigrants from South America
Paraguayans
$85,611
MEDIAN HOUSEHOLD INCOME
58.1/ 100
METRIC RATING
171st/ 347
METRIC RANK
$95,737
MEDIAN HOUSEHOLD INCOME
99.9/ 100
METRIC RATING
53rd/ 347
METRIC RANK
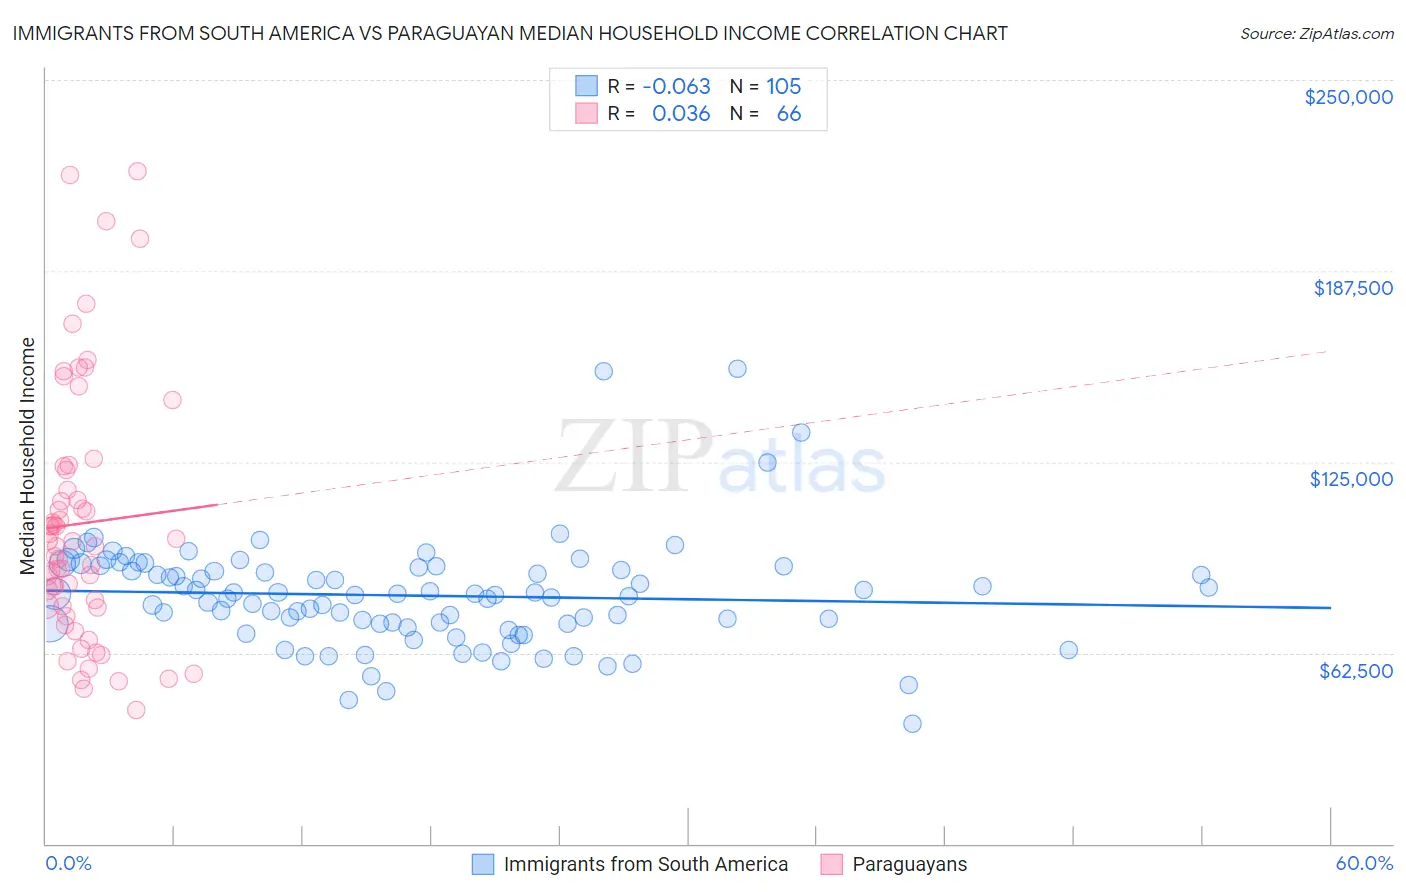
Immigrants from South America vs Paraguayan Median Household Income Correlation Chart
The statistical analysis conducted on geographies consisting of 485,852,946 people shows a slight negative correlation between the proportion of Immigrants from South America and median household income in the United States with a correlation coefficient (R) of -0.063 and weighted average of $85,611. Similarly, the statistical analysis conducted on geographies consisting of 95,096,064 people shows no correlation between the proportion of Paraguayans and median household income in the United States with a correlation coefficient (R) of 0.036 and weighted average of $95,737, a difference of 11.8%.
Median Household Income Correlation Summary
| Measurement | Immigrants from South America | Paraguayan |
| Minimum | $39,375 | $43,906 |
| Maximum | $155,583 | $220,060 |
| Range | $116,208 | $176,154 |
| Mean | $81,259 | $104,819 |
| Median | $81,529 | $98,291 |
| Interquartile 25% (IQ1) | $71,899 | $77,788 |
| Interquartile 75% (IQ3) | $90,608 | $122,293 |
| Interquartile Range (IQR) | $18,709 | $44,505 |
| Standard Deviation (Sample) | $17,852 | $41,190 |
| Standard Deviation (Population) | $17,766 | $40,877 |
Similar Demographics by Median Household Income
Demographics Similar to Immigrants from South America by Median Household Income
In terms of median household income, the demographic groups most similar to Immigrants from South America are Slovene ($85,562, a difference of 0.060%), Swiss ($85,681, a difference of 0.080%), Colombian ($85,716, a difference of 0.12%), Icelander ($85,797, a difference of 0.22%), and Immigrants ($85,818, a difference of 0.24%).
| Demographics | Rating | Rank | Median Household Income |
| Irish | 66.2 /100 | #164 | Good $86,145 |
| Norwegians | 65.3 /100 | #165 | Good $86,084 |
| Scandinavians | 65.1 /100 | #166 | Good $86,073 |
| Immigrants | Immigrants | 61.3 /100 | #167 | Good $85,818 |
| Icelanders | 61.0 /100 | #168 | Good $85,797 |
| Colombians | 59.7 /100 | #169 | Average $85,716 |
| Swiss | 59.2 /100 | #170 | Average $85,681 |
| Immigrants | South America | 58.1 /100 | #171 | Average $85,611 |
| Slovenes | 57.4 /100 | #172 | Average $85,562 |
| Immigrants | Cameroon | 53.4 /100 | #173 | Average $85,314 |
| Scottish | 50.0 /100 | #174 | Average $85,101 |
| Immigrants | Costa Rica | 49.2 /100 | #175 | Average $85,054 |
| Alsatians | 49.2 /100 | #176 | Average $85,053 |
| Immigrants | Eritrea | 48.8 /100 | #177 | Average $85,025 |
| Czechoslovakians | 47.8 /100 | #178 | Average $84,965 |
Demographics Similar to Paraguayans by Median Household Income
In terms of median household income, the demographic groups most similar to Paraguayans are Immigrants from South Africa ($95,800, a difference of 0.070%), Egyptian ($95,673, a difference of 0.070%), Estonian ($95,930, a difference of 0.20%), Immigrants from Czechoslovakia ($95,319, a difference of 0.44%), and Immigrants from Austria ($95,277, a difference of 0.48%).
| Demographics | Rating | Rank | Median Household Income |
| Australians | 99.9 /100 | #46 | Exceptional $96,490 |
| Immigrants | Russia | 99.9 /100 | #47 | Exceptional $96,378 |
| Cambodians | 99.9 /100 | #48 | Exceptional $96,324 |
| Immigrants | Malaysia | 99.9 /100 | #49 | Exceptional $96,292 |
| Bulgarians | 99.9 /100 | #50 | Exceptional $96,290 |
| Estonians | 99.9 /100 | #51 | Exceptional $95,930 |
| Immigrants | South Africa | 99.9 /100 | #52 | Exceptional $95,800 |
| Paraguayans | 99.9 /100 | #53 | Exceptional $95,737 |
| Egyptians | 99.9 /100 | #54 | Exceptional $95,673 |
| Immigrants | Czechoslovakia | 99.9 /100 | #55 | Exceptional $95,319 |
| Immigrants | Austria | 99.9 /100 | #56 | Exceptional $95,277 |
| New Zealanders | 99.8 /100 | #57 | Exceptional $95,146 |
| Soviet Union | 99.8 /100 | #58 | Exceptional $95,098 |
| Immigrants | Europe | 99.8 /100 | #59 | Exceptional $95,032 |
| Koreans | 99.8 /100 | #60 | Exceptional $95,018 |