Immigrants from South America vs Jamaican Median Male Earnings
COMPARE
Immigrants from South America
Jamaican
Median Male Earnings
Median Male Earnings Comparison
Immigrants from South America
Jamaicans
$53,962
MEDIAN MALE EARNINGS
37.3/ 100
METRIC RATING
183rd/ 347
METRIC RANK
$48,632
MEDIAN MALE EARNINGS
0.3/ 100
METRIC RATING
273rd/ 347
METRIC RANK
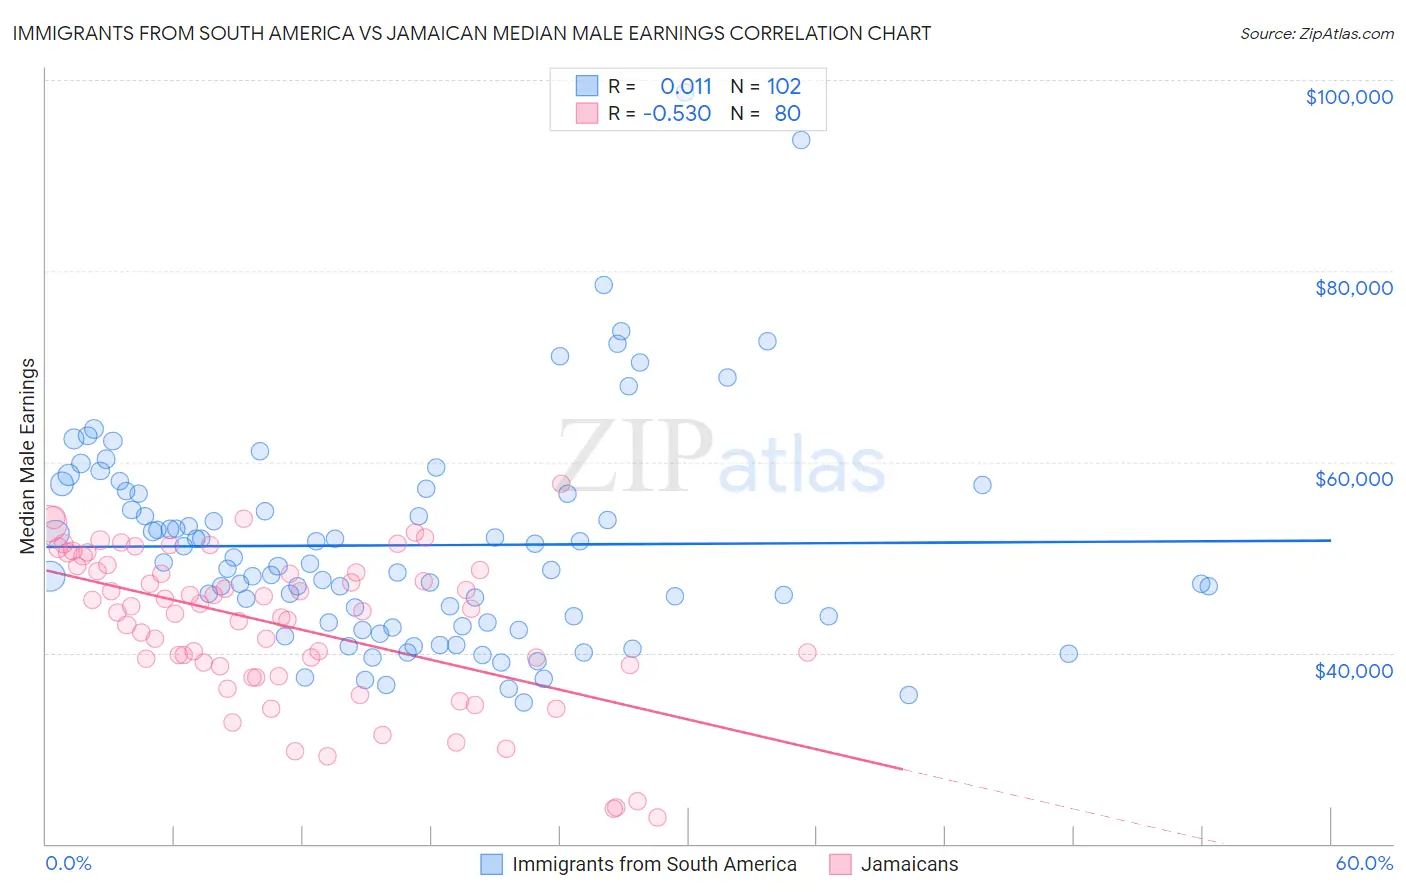
Immigrants from South America vs Jamaican Median Male Earnings Correlation Chart
The statistical analysis conducted on geographies consisting of 486,116,321 people shows no correlation between the proportion of Immigrants from South America and median male earnings in the United States with a correlation coefficient (R) of 0.011 and weighted average of $53,962. Similarly, the statistical analysis conducted on geographies consisting of 367,962,773 people shows a substantial negative correlation between the proportion of Jamaicans and median male earnings in the United States with a correlation coefficient (R) of -0.530 and weighted average of $48,632, a difference of 11.0%.
Median Male Earnings Correlation Summary
| Measurement | Immigrants from South America | Jamaican |
| Minimum | $34,825 | $22,747 |
| Maximum | $98,656 | $57,769 |
| Range | $63,831 | $35,022 |
| Mean | $51,267 | $42,945 |
| Median | $48,941 | $44,504 |
| Interquartile 25% (IQ1) | $43,131 | $38,662 |
| Interquartile 75% (IQ3) | $56,719 | $48,891 |
| Interquartile Range (IQR) | $13,589 | $10,229 |
| Standard Deviation (Sample) | $11,368 | $7,942 |
| Standard Deviation (Population) | $11,312 | $7,893 |
Similar Demographics by Median Male Earnings
Demographics Similar to Immigrants from South America by Median Male Earnings
In terms of median male earnings, the demographic groups most similar to Immigrants from South America are Yugoslavian ($53,967, a difference of 0.010%), White/Caucasian ($53,925, a difference of 0.070%), Immigrants from Sierra Leone ($53,905, a difference of 0.11%), Colombian ($53,832, a difference of 0.24%), and Immigrants ($54,168, a difference of 0.38%).
| Demographics | Rating | Rank | Median Male Earnings |
| Spaniards | 47.8 /100 | #176 | Average $54,401 |
| Costa Ricans | 44.8 /100 | #177 | Average $54,279 |
| Sierra Leoneans | 44.8 /100 | #178 | Average $54,279 |
| Celtics | 43.9 /100 | #179 | Average $54,242 |
| Iraqis | 42.5 /100 | #180 | Average $54,182 |
| Immigrants | Immigrants | 42.1 /100 | #181 | Average $54,168 |
| Yugoslavians | 37.4 /100 | #182 | Fair $53,967 |
| Immigrants | South America | 37.3 /100 | #183 | Fair $53,962 |
| Whites/Caucasians | 36.5 /100 | #184 | Fair $53,925 |
| Immigrants | Sierra Leone | 36.0 /100 | #185 | Fair $53,905 |
| Colombians | 34.4 /100 | #186 | Fair $53,832 |
| Immigrants | Eritrea | 31.8 /100 | #187 | Fair $53,715 |
| Immigrants | Eastern Africa | 31.8 /100 | #188 | Fair $53,713 |
| Puget Sound Salish | 31.6 /100 | #189 | Fair $53,704 |
| Uruguayans | 31.1 /100 | #190 | Fair $53,680 |
Demographics Similar to Jamaicans by Median Male Earnings
In terms of median male earnings, the demographic groups most similar to Jamaicans are Salvadoran ($48,646, a difference of 0.030%), Cherokee ($48,669, a difference of 0.080%), Colville ($48,516, a difference of 0.24%), Potawatomi ($48,768, a difference of 0.28%), and Immigrants from Somalia ($48,439, a difference of 0.40%).
| Demographics | Rating | Rank | Median Male Earnings |
| Somalis | 0.5 /100 | #266 | Tragic $49,025 |
| Spanish Americans | 0.5 /100 | #267 | Tragic $49,008 |
| Ute | 0.4 /100 | #268 | Tragic $48,899 |
| Tsimshian | 0.4 /100 | #269 | Tragic $48,836 |
| Potawatomi | 0.4 /100 | #270 | Tragic $48,768 |
| Cherokee | 0.3 /100 | #271 | Tragic $48,669 |
| Salvadorans | 0.3 /100 | #272 | Tragic $48,646 |
| Jamaicans | 0.3 /100 | #273 | Tragic $48,632 |
| Colville | 0.3 /100 | #274 | Tragic $48,516 |
| Immigrants | Somalia | 0.3 /100 | #275 | Tragic $48,439 |
| Blackfeet | 0.3 /100 | #276 | Tragic $48,402 |
| Belizeans | 0.2 /100 | #277 | Tragic $48,358 |
| Immigrants | Liberia | 0.2 /100 | #278 | Tragic $48,317 |
| Hmong | 0.2 /100 | #279 | Tragic $48,254 |
| Comanche | 0.2 /100 | #280 | Tragic $48,202 |