Immigrants from South Africa vs Lithuanian Median Male Earnings
COMPARE
Immigrants from South Africa
Lithuanian
Median Male Earnings
Median Male Earnings Comparison
Immigrants from South Africa
Lithuanians
$62,899
MEDIAN MALE EARNINGS
100.0/ 100
METRIC RATING
39th/ 347
METRIC RANK
$61,228
MEDIAN MALE EARNINGS
99.9/ 100
METRIC RATING
56th/ 347
METRIC RANK
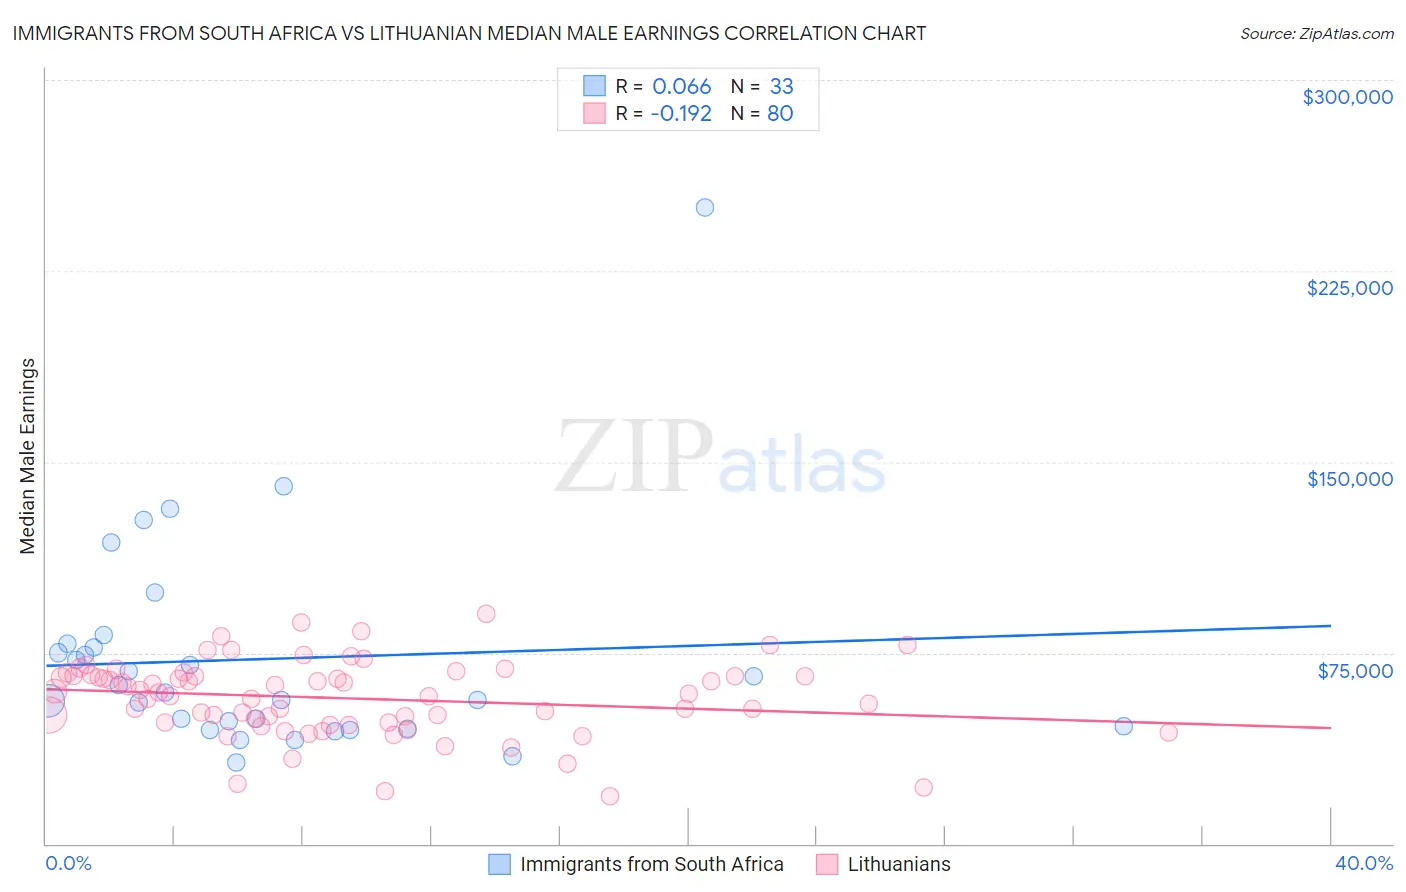
Immigrants from South Africa vs Lithuanian Median Male Earnings Correlation Chart
The statistical analysis conducted on geographies consisting of 233,272,809 people shows a slight positive correlation between the proportion of Immigrants from South Africa and median male earnings in the United States with a correlation coefficient (R) of 0.066 and weighted average of $62,899. Similarly, the statistical analysis conducted on geographies consisting of 421,749,133 people shows a poor negative correlation between the proportion of Lithuanians and median male earnings in the United States with a correlation coefficient (R) of -0.192 and weighted average of $61,228, a difference of 2.7%.
Median Male Earnings Correlation Summary
| Measurement | Immigrants from South Africa | Lithuanian |
| Minimum | $31,875 | $18,839 |
| Maximum | $250,001 | $90,313 |
| Range | $218,126 | $71,474 |
| Mean | $72,583 | $57,160 |
| Median | $59,605 | $59,359 |
| Interquartile 25% (IQ1) | $45,646 | $47,714 |
| Interquartile 75% (IQ3) | $77,820 | $66,000 |
| Interquartile Range (IQR) | $32,174 | $18,286 |
| Standard Deviation (Sample) | $42,392 | $14,769 |
| Standard Deviation (Population) | $41,745 | $14,676 |
Demographics Similar to Immigrants from South Africa and Lithuanians by Median Male Earnings
In terms of median male earnings, the demographic groups most similar to Immigrants from South Africa are Australian ($62,857, a difference of 0.070%), Maltese ($62,953, a difference of 0.090%), Immigrants from Turkey ($62,728, a difference of 0.27%), Immigrants from Sri Lanka ($63,099, a difference of 0.32%), and Immigrants from Greece ($62,689, a difference of 0.34%). Similarly, the demographic groups most similar to Lithuanians are Immigrants from Scotland ($61,220, a difference of 0.010%), Greek ($61,242, a difference of 0.020%), Immigrants from Latvia ($61,422, a difference of 0.32%), South African ($61,460, a difference of 0.38%), and Immigrants from Norway ($61,628, a difference of 0.65%).
| Demographics | Rating | Rank | Median Male Earnings |
| Immigrants | Sri Lanka | 100.0 /100 | #37 | Exceptional $63,099 |
| Maltese | 100.0 /100 | #38 | Exceptional $62,953 |
| Immigrants | South Africa | 100.0 /100 | #39 | Exceptional $62,899 |
| Australians | 100.0 /100 | #40 | Exceptional $62,857 |
| Immigrants | Turkey | 100.0 /100 | #41 | Exceptional $62,728 |
| Immigrants | Greece | 100.0 /100 | #42 | Exceptional $62,689 |
| Immigrants | Belarus | 100.0 /100 | #43 | Exceptional $62,658 |
| Cambodians | 100.0 /100 | #44 | Exceptional $62,516 |
| Bulgarians | 100.0 /100 | #45 | Exceptional $62,378 |
| Immigrants | Czechoslovakia | 99.9 /100 | #46 | Exceptional $62,217 |
| Immigrants | Austria | 99.9 /100 | #47 | Exceptional $62,164 |
| Immigrants | Malaysia | 99.9 /100 | #48 | Exceptional $62,121 |
| Immigrants | Europe | 99.9 /100 | #49 | Exceptional $62,057 |
| Bhutanese | 99.9 /100 | #50 | Exceptional $61,759 |
| Estonians | 99.9 /100 | #51 | Exceptional $61,710 |
| Immigrants | Norway | 99.9 /100 | #52 | Exceptional $61,628 |
| South Africans | 99.9 /100 | #53 | Exceptional $61,460 |
| Immigrants | Latvia | 99.9 /100 | #54 | Exceptional $61,422 |
| Greeks | 99.9 /100 | #55 | Exceptional $61,242 |
| Lithuanians | 99.9 /100 | #56 | Exceptional $61,228 |
| Immigrants | Scotland | 99.9 /100 | #57 | Exceptional $61,220 |