Immigrants from South Africa vs Cree Median Earnings
COMPARE
Immigrants from South Africa
Cree
Median Earnings
Median Earnings Comparison
Immigrants from South Africa
Cree
$51,850
MEDIAN EARNINGS
100.0/ 100
METRIC RATING
50th/ 347
METRIC RANK
$42,777
MEDIAN EARNINGS
0.6/ 100
METRIC RATING
267th/ 347
METRIC RANK
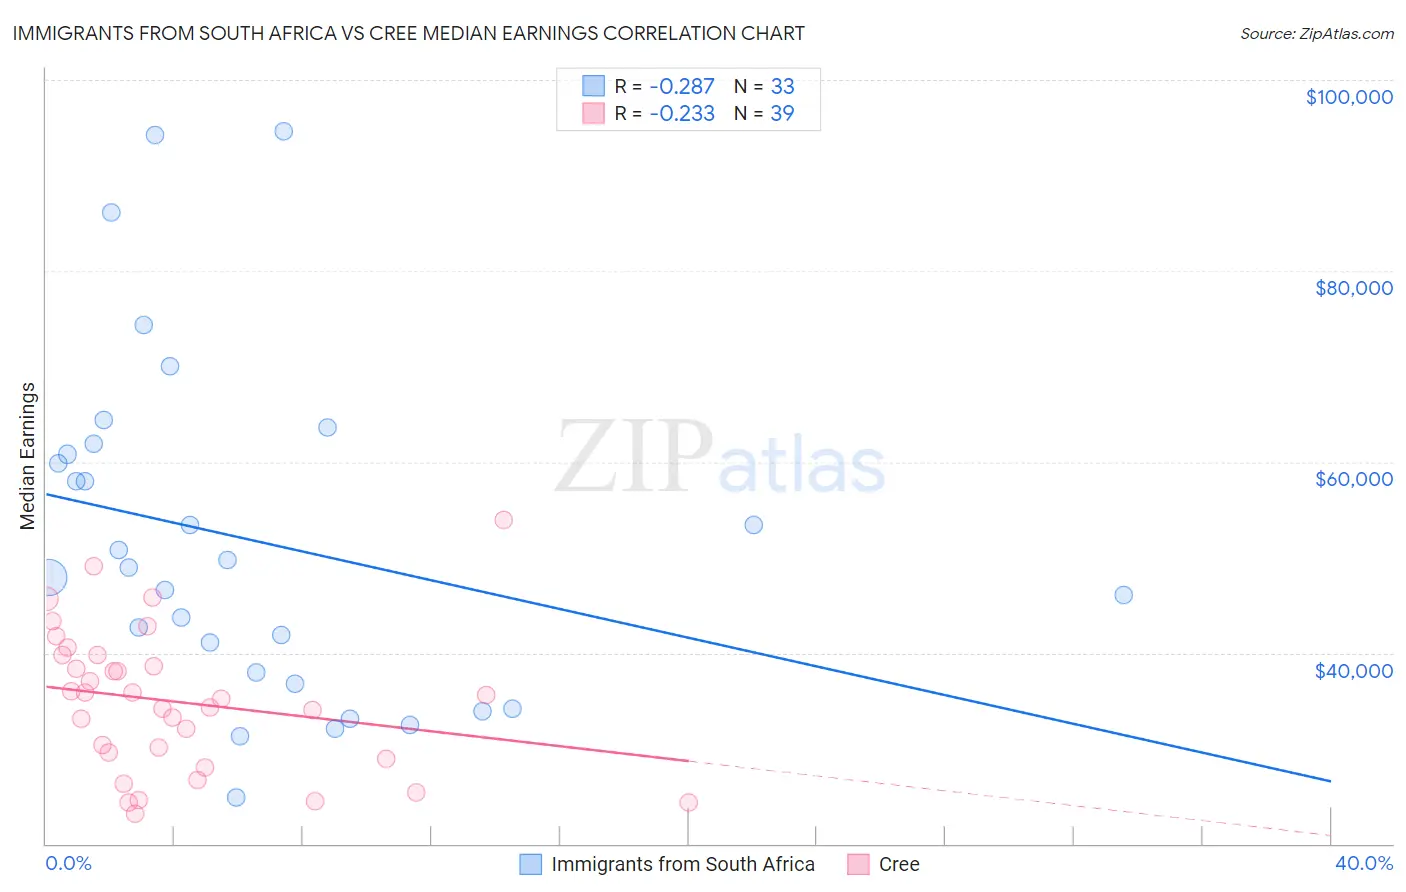
Immigrants from South Africa vs Cree Median Earnings Correlation Chart
The statistical analysis conducted on geographies consisting of 233,296,995 people shows a weak negative correlation between the proportion of Immigrants from South Africa and median earnings in the United States with a correlation coefficient (R) of -0.287 and weighted average of $51,850. Similarly, the statistical analysis conducted on geographies consisting of 76,210,467 people shows a weak negative correlation between the proportion of Cree and median earnings in the United States with a correlation coefficient (R) of -0.233 and weighted average of $42,777, a difference of 21.2%.
Median Earnings Correlation Summary
| Measurement | Immigrants from South Africa | Cree |
| Minimum | $24,853 | $23,200 |
| Maximum | $94,663 | $53,900 |
| Range | $69,810 | $30,700 |
| Mean | $51,765 | $34,814 |
| Median | $48,953 | $35,233 |
| Interquartile 25% (IQ1) | $37,328 | $28,896 |
| Interquartile 75% (IQ3) | $61,361 | $39,775 |
| Interquartile Range (IQR) | $24,033 | $10,879 |
| Standard Deviation (Sample) | $17,731 | $7,415 |
| Standard Deviation (Population) | $17,460 | $7,320 |
Similar Demographics by Median Earnings
Demographics Similar to Immigrants from South Africa by Median Earnings
In terms of median earnings, the demographic groups most similar to Immigrants from South Africa are Immigrants from Austria ($51,826, a difference of 0.050%), Estonian ($51,772, a difference of 0.15%), Immigrants from Norway ($51,758, a difference of 0.18%), Immigrants from Indonesia ($51,715, a difference of 0.26%), and Egyptian ($51,701, a difference of 0.29%).
| Demographics | Rating | Rank | Median Earnings |
| Immigrants | Malaysia | 100.0 /100 | #43 | Exceptional $52,514 |
| Bulgarians | 100.0 /100 | #44 | Exceptional $52,512 |
| Immigrants | Czechoslovakia | 100.0 /100 | #45 | Exceptional $52,361 |
| Bhutanese | 100.0 /100 | #46 | Exceptional $52,297 |
| Australians | 100.0 /100 | #47 | Exceptional $52,294 |
| Immigrants | Europe | 100.0 /100 | #48 | Exceptional $52,195 |
| Bolivians | 100.0 /100 | #49 | Exceptional $52,005 |
| Immigrants | South Africa | 100.0 /100 | #50 | Exceptional $51,850 |
| Immigrants | Austria | 99.9 /100 | #51 | Exceptional $51,826 |
| Estonians | 99.9 /100 | #52 | Exceptional $51,772 |
| Immigrants | Norway | 99.9 /100 | #53 | Exceptional $51,758 |
| Immigrants | Indonesia | 99.9 /100 | #54 | Exceptional $51,715 |
| Egyptians | 99.9 /100 | #55 | Exceptional $51,701 |
| Immigrants | Pakistan | 99.9 /100 | #56 | Exceptional $51,693 |
| Immigrants | Eastern Europe | 99.9 /100 | #57 | Exceptional $51,624 |
Demographics Similar to Cree by Median Earnings
In terms of median earnings, the demographic groups most similar to Cree are American ($42,742, a difference of 0.080%), Belizean ($42,702, a difference of 0.17%), Immigrants from Laos ($42,884, a difference of 0.25%), Osage ($42,651, a difference of 0.29%), and Salvadoran ($42,912, a difference of 0.32%).
| Demographics | Rating | Rank | Median Earnings |
| Immigrants | Somalia | 0.9 /100 | #260 | Tragic $43,100 |
| Immigrants | Jamaica | 0.8 /100 | #261 | Tragic $43,026 |
| Nicaraguans | 0.8 /100 | #262 | Tragic $43,026 |
| Inupiat | 0.8 /100 | #263 | Tragic $43,000 |
| Immigrants | Liberia | 0.7 /100 | #264 | Tragic $42,923 |
| Salvadorans | 0.7 /100 | #265 | Tragic $42,912 |
| Immigrants | Laos | 0.7 /100 | #266 | Tragic $42,884 |
| Cree | 0.6 /100 | #267 | Tragic $42,777 |
| Americans | 0.6 /100 | #268 | Tragic $42,742 |
| Belizeans | 0.5 /100 | #269 | Tragic $42,702 |
| Osage | 0.5 /100 | #270 | Tragic $42,651 |
| Pennsylvania Germans | 0.5 /100 | #271 | Tragic $42,615 |
| Iroquois | 0.4 /100 | #272 | Tragic $42,430 |
| Immigrants | Dominica | 0.4 /100 | #273 | Tragic $42,420 |
| Immigrants | El Salvador | 0.4 /100 | #274 | Tragic $42,413 |