Immigrants from Singapore vs Immigrants from Croatia Householder Income Ages 45 - 64 years
COMPARE
Immigrants from Singapore
Immigrants from Croatia
Householder Income Ages 45 - 64 years
Householder Income Ages 45 - 64 years Comparison
Immigrants from Singapore
Immigrants from Croatia
$129,514
HOUSEHOLDER INCOME AGES 45 - 64 YEARS
100.0/ 100
METRIC RATING
5th/ 347
METRIC RANK
$108,304
HOUSEHOLDER INCOME AGES 45 - 64 YEARS
98.2/ 100
METRIC RATING
93rd/ 347
METRIC RANK
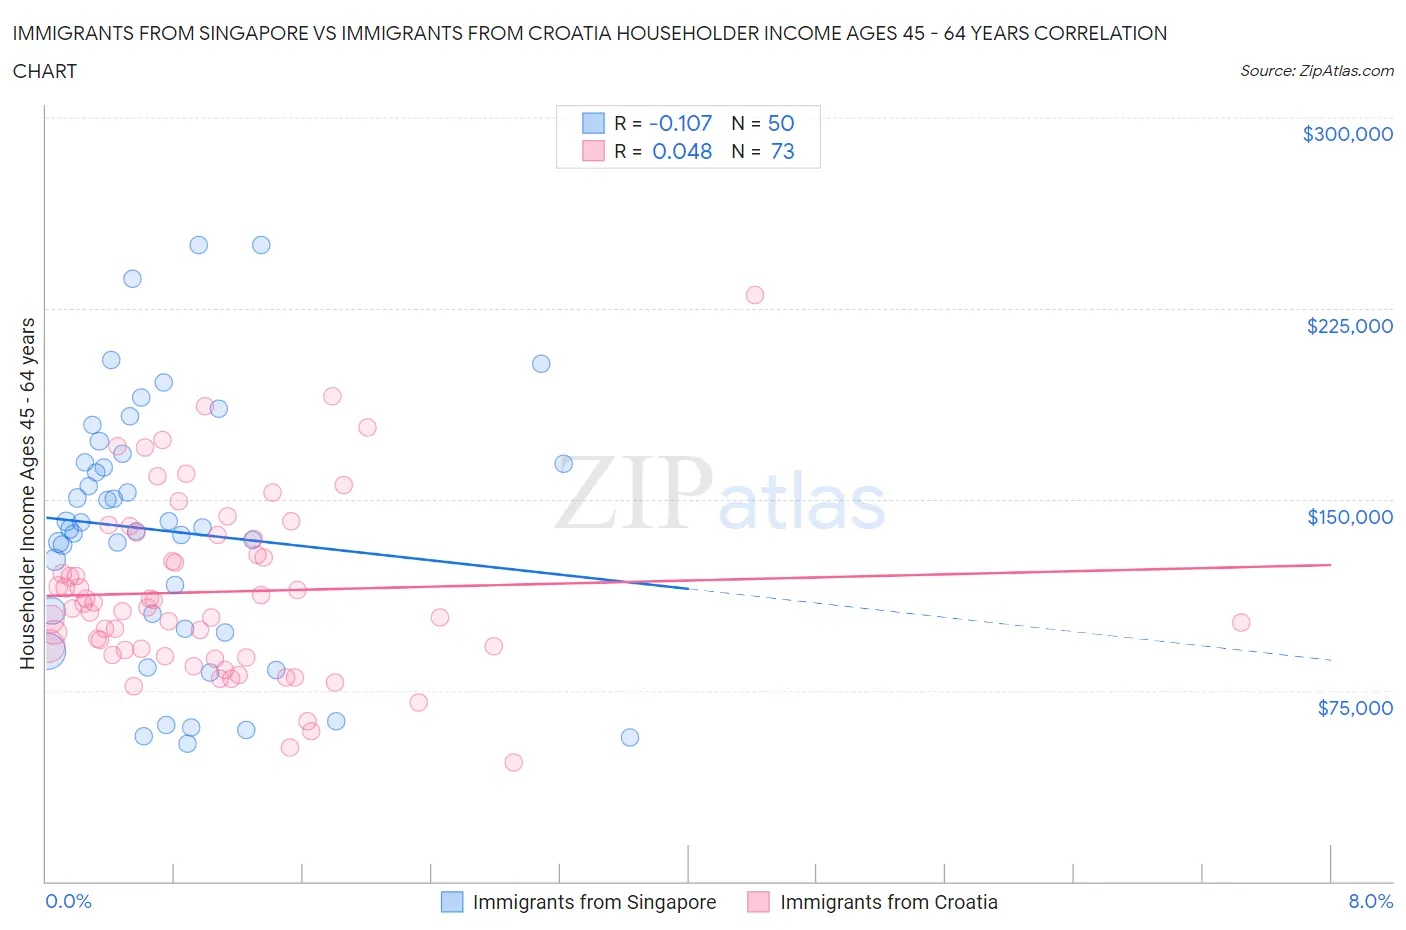
Immigrants from Singapore vs Immigrants from Croatia Householder Income Ages 45 - 64 years Correlation Chart
The statistical analysis conducted on geographies consisting of 137,361,337 people shows a poor negative correlation between the proportion of Immigrants from Singapore and household income with householder between the ages 45 and 64 in the United States with a correlation coefficient (R) of -0.107 and weighted average of $129,514. Similarly, the statistical analysis conducted on geographies consisting of 132,538,212 people shows no correlation between the proportion of Immigrants from Croatia and household income with householder between the ages 45 and 64 in the United States with a correlation coefficient (R) of 0.048 and weighted average of $108,304, a difference of 19.6%.
Householder Income Ages 45 - 64 years Correlation Summary
| Measurement | Immigrants from Singapore | Immigrants from Croatia |
| Minimum | $54,074 | $46,667 |
| Maximum | $250,001 | $230,494 |
| Range | $195,927 | $183,827 |
| Mean | $137,475 | $113,652 |
| Median | $138,678 | $107,692 |
| Interquartile 25% (IQ1) | $99,063 | $89,990 |
| Interquartile 75% (IQ3) | $164,348 | $135,056 |
| Interquartile Range (IQR) | $65,285 | $45,066 |
| Standard Deviation (Sample) | $49,976 | $34,547 |
| Standard Deviation (Population) | $49,474 | $34,310 |
Similar Demographics by Householder Income Ages 45 - 64 years
Demographics Similar to Immigrants from Singapore by Householder Income Ages 45 - 64 years
In terms of householder income ages 45 - 64 years, the demographic groups most similar to Immigrants from Singapore are Thai ($129,560, a difference of 0.040%), Iranian ($129,350, a difference of 0.13%), Immigrants from Hong Kong ($127,500, a difference of 1.6%), Immigrants from Iran ($126,940, a difference of 2.0%), and Immigrants from India ($132,488, a difference of 2.3%).
| Demographics | Rating | Rank | Householder Income Ages 45 - 64 years |
| Immigrants | Taiwan | 100.0 /100 | #1 | Exceptional $135,508 |
| Filipinos | 100.0 /100 | #2 | Exceptional $134,910 |
| Immigrants | India | 100.0 /100 | #3 | Exceptional $132,488 |
| Thais | 100.0 /100 | #4 | Exceptional $129,560 |
| Immigrants | Singapore | 100.0 /100 | #5 | Exceptional $129,514 |
| Iranians | 100.0 /100 | #6 | Exceptional $129,350 |
| Immigrants | Hong Kong | 100.0 /100 | #7 | Exceptional $127,500 |
| Immigrants | Iran | 100.0 /100 | #8 | Exceptional $126,940 |
| Okinawans | 100.0 /100 | #9 | Exceptional $124,796 |
| Immigrants | South Central Asia | 100.0 /100 | #10 | Exceptional $124,188 |
| Cypriots | 100.0 /100 | #11 | Exceptional $123,396 |
| Immigrants | Israel | 100.0 /100 | #12 | Exceptional $122,893 |
| Immigrants | Ireland | 100.0 /100 | #13 | Exceptional $122,757 |
| Indians (Asian) | 100.0 /100 | #14 | Exceptional $122,343 |
| Immigrants | Eastern Asia | 100.0 /100 | #15 | Exceptional $122,222 |
Demographics Similar to Immigrants from Croatia by Householder Income Ages 45 - 64 years
In terms of householder income ages 45 - 64 years, the demographic groups most similar to Immigrants from Croatia are Sri Lankan ($108,270, a difference of 0.030%), Immigrants from Hungary ($108,267, a difference of 0.030%), Immigrants from Argentina ($108,264, a difference of 0.040%), Croatian ($108,383, a difference of 0.070%), and Immigrants from Philippines ($108,471, a difference of 0.15%).
| Demographics | Rating | Rank | Householder Income Ages 45 - 64 years |
| Austrians | 98.5 /100 | #86 | Exceptional $108,692 |
| Tongans | 98.5 /100 | #87 | Exceptional $108,643 |
| Romanians | 98.5 /100 | #88 | Exceptional $108,609 |
| Ukrainians | 98.3 /100 | #89 | Exceptional $108,475 |
| Immigrants | Philippines | 98.3 /100 | #90 | Exceptional $108,471 |
| Immigrants | Lebanon | 98.3 /100 | #91 | Exceptional $108,471 |
| Croatians | 98.3 /100 | #92 | Exceptional $108,383 |
| Immigrants | Croatia | 98.2 /100 | #93 | Exceptional $108,304 |
| Sri Lankans | 98.2 /100 | #94 | Exceptional $108,270 |
| Immigrants | Hungary | 98.2 /100 | #95 | Exceptional $108,267 |
| Immigrants | Argentina | 98.2 /100 | #96 | Exceptional $108,264 |
| Northern Europeans | 97.8 /100 | #97 | Exceptional $107,870 |
| Immigrants | Southern Europe | 97.7 /100 | #98 | Exceptional $107,775 |
| Palestinians | 97.6 /100 | #99 | Exceptional $107,721 |
| Immigrants | Serbia | 97.4 /100 | #100 | Exceptional $107,569 |