Immigrants from Senegal vs Greek Householder Income Ages 45 - 64 years

COMPARE

Immigrants from Senegal
Race
Ancestry
AfghanAfricanAlaska NativeAlaskan AthabascanAlbanianAleutAlsatianAmericanApacheArabArapahoArgentineanArmenianAssyrian/Chaldean/SyriacAustralianAustrianBahamianBangladeshiBarbadianBasqueBelgianBelizeanBermudanBhutaneseBlackfeetBolivianBrazilianBritishBritish West IndianBulgarianBurmeseCajunCambodianCanadianCape VerdeanCarpatho RusynCelticCentral AmericanCentral American IndianCherokeeCheyenneChickasawChileanChineseChippewaChoctawColombianColvilleComancheCosta RicanCreeCreekCroatianCrowCubanCypriotCzechCzechoslovakianDanishDelawareDominicanDutchDutch West IndianEastern EuropeanEcuadorianEgyptianEnglishEstonianEthiopianEuropeanFijianFilipinoFinnishFrenchFrench American IndianFrench CanadianGermanGerman RussianGhanaianGuamanian/ChamorroGuatemalanGuyaneseHaitianHmongHonduranHopiHoumaHungarianIcelanderIndian (Asian)IndonesianInupiatIranianIraqiIrishIroquoisIsraeliItalianJamaicanJapaneseJordanianKenyanKiowaKoreanLaotianLatvianLebaneseLiberianLithuanianLumbeeLuxembourgerMacedonianMalaysianMalteseMarshalleseMenomineeMexicanMexican American IndianMongolianMoroccanNative HawaiianNavajoNepaleseNew ZealanderNicaraguanNigerianNorthern EuropeanNorwegianOkinawanOsageOttawaPaiutePakistaniPalestinianPanamanianParaguayanPennsylvania GermanPeruvianPimaPolishPortuguesePotawatomiPuebloPuerto RicanPuget Sound SalishRomanianRussianSalvadoranSamoanScandinavianScotch-IrishScottishSeminoleSenegaleseSerbianShoshoneSierra LeoneanSiouxSlavicSlovakSloveneSomaliSouth AfricanSouth AmericanSouth American IndianSoviet UnionSpaniardSpanishSpanish AmericanSpanish American IndianSri LankanSubsaharan AfricanSudaneseSwedishSwissSyrianTaiwaneseThaiTlingit-HaidaTohono O'OdhamTonganTrinidadian and TobagonianTsimshianTurkishU.S. Virgin IslanderUgandanUkrainianUruguayanUteVenezuelanVietnameseWelshWest IndianYakamaYaquiYugoslavianYumanYup'ikZimbabwean
Immigration
NonimmigrantsImmigrantsAfghanistanAfricaAlbaniaArgentinaArmeniaAsiaAustraliaAustriaBahamasBangladeshBarbadosBelarusBelgiumBelizeBoliviaBosnia and HerzegovinaBrazilBulgariaBurma/MyanmarCabo VerdeCambodiaCameroonCanadaCaribbeanCentral AmericaChileChinaColombiaCongoCosta RicaCroatiaCubaCzechoslovakiaDenmarkDominicaDominican RepublicEastern AfricaEastern AsiaEastern EuropeEcuadorEgyptEl SalvadorEnglandEritreaEthiopiaEuropeFijiFranceGermanyGhanaGreeceGrenadaGuatemalaGuyanaHaitiHondurasHong KongHungaryIndiaIndonesiaIranIraqIrelandIsraelItalyJamaicaJapanJordanKazakhstanKenyaKoreaKuwaitLaosLatin AmericaLatviaLebanonLiberiaLithuaniaMalaysiaMexicoMicronesiaMiddle AfricaMoldovaMoroccoNepalNetherlandsNicaraguaNigeriaNorth AmericaNorth MacedoniaNorthern AfricaNorthern EuropeNorwayOceaniaPakistanPanamaPeruPhilippinesPolandPortugalRomaniaRussiaSaudi ArabiaScotlandSenegalSerbiaSierra LeoneSingaporeSomaliaSouth AfricaSouth AmericaSouth Central AsiaSouth Eastern AsiaSouthern EuropeSpainSri LankaSt. Vincent and the GrenadinesSudanSwedenSwitzerlandSyriaTaiwanThailandTrinidad and TobagoTurkeyUgandaUkraineUruguayUzbekistanVenezuelaVietnamWest IndiesWestern AfricaWestern AsiaWestern EuropeYemenZaireZimbabweAzores
Greek
Race
Ancestry
AfghanAfricanAlaska NativeAlaskan AthabascanAlbanianAleutAlsatianAmericanApacheArabArapahoArgentineanArmenianAssyrian/Chaldean/SyriacAustralianAustrianBahamianBangladeshiBarbadianBasqueBelgianBelizeanBermudanBhutaneseBlackfeetBolivianBrazilianBritishBritish West IndianBulgarianBurmeseCajunCambodianCanadianCape VerdeanCarpatho RusynCelticCentral AmericanCentral American IndianCherokeeCheyenneChickasawChileanChineseChippewaChoctawColombianColvilleComancheCosta RicanCreeCreekCroatianCrowCubanCypriotCzechCzechoslovakianDanishDelawareDominicanDutchDutch West IndianEastern EuropeanEcuadorianEgyptianEnglishEstonianEthiopianEuropeanFijianFilipinoFinnishFrenchFrench American IndianFrench CanadianGermanGerman RussianGhanaianGreekGuamanian/ChamorroGuatemalanGuyaneseHaitianHmongHonduranHopiHoumaHungarianIcelanderIndian (Asian)IndonesianInupiatIranianIraqiIrishIroquoisIsraeliItalianJamaicanJapaneseJordanianKenyanKiowaKoreanLaotianLatvianLebaneseLiberianLithuanianLumbeeLuxembourgerMacedonianMalaysianMalteseMarshalleseMenomineeMexicanMexican American IndianMongolianMoroccanNative HawaiianNavajoNepaleseNew ZealanderNicaraguanNigerianNorthern EuropeanNorwegianOkinawanOsageOttawaPaiutePakistaniPalestinianPanamanianParaguayanPennsylvania GermanPeruvianPimaPolishPortuguesePotawatomiPuebloPuerto RicanPuget Sound SalishRomanianRussianSalvadoranSamoanScandinavianScotch-IrishScottishSeminoleSenegaleseSerbianShoshoneSierra LeoneanSiouxSlavicSlovakSloveneSomaliSouth AfricanSouth AmericanSouth American IndianSoviet UnionSpaniardSpanishSpanish AmericanSpanish American IndianSri LankanSubsaharan AfricanSudaneseSwedishSwissSyrianTaiwaneseThaiTlingit-HaidaTohono O'OdhamTonganTrinidadian and TobagonianTsimshianTurkishU.S. Virgin IslanderUgandanUkrainianUruguayanUteVenezuelanVietnameseWelshWest IndianYakamaYaquiYugoslavianYumanYup'ikZimbabwean
Immigration
NonimmigrantsImmigrantsAfghanistanAfricaAlbaniaArgentinaArmeniaAsiaAustraliaAustriaBahamasBangladeshBarbadosBelarusBelgiumBelizeBoliviaBosnia and HerzegovinaBrazilBulgariaBurma/MyanmarCabo VerdeCambodiaCameroonCanadaCaribbeanCentral AmericaChileChinaColombiaCongoCosta RicaCroatiaCubaCzechoslovakiaDenmarkDominicaDominican RepublicEastern AfricaEastern AsiaEastern EuropeEcuadorEgyptEl SalvadorEnglandEritreaEthiopiaEuropeFijiFranceGermanyGhanaGreeceGrenadaGuatemalaGuyanaHaitiHondurasHong KongHungaryIndiaIndonesiaIranIraqIrelandIsraelItalyJamaicaJapanJordanKazakhstanKenyaKoreaKuwaitLaosLatin AmericaLatviaLebanonLiberiaLithuaniaMalaysiaMexicoMicronesiaMiddle AfricaMoldovaMoroccoNepalNetherlandsNicaraguaNigeriaNorth AmericaNorth MacedoniaNorthern AfricaNorthern EuropeNorwayOceaniaPakistanPanamaPeruPhilippinesPolandPortugalRomaniaRussiaSaudi ArabiaScotlandSerbiaSierra LeoneSingaporeSomaliaSouth AfricaSouth AmericaSouth Central AsiaSouth Eastern AsiaSouthern EuropeSpainSri LankaSt. Vincent and the GrenadinesSudanSwedenSwitzerlandSyriaTaiwanThailandTrinidad and TobagoTurkeyUgandaUkraineUruguayUzbekistanVenezuelaVietnamWest IndiesWestern AfricaWestern AsiaWestern EuropeYemenZaireZimbabweAzores
Householder Income Ages 45 - 64 years
Income
Poverty
Unemployment
Labor Participation
Family Structure
Vehicle Availability
Education Level
Disability

Householder Income Ages 45 - 64 years Comparison

Immigrants from Senegal

Greeks

Tragic
Exceptional
$88,421
HOUSEHOLDER INCOME AGES 45 - 64 YEARS
0.3/ 100
METRIC RATING
263rd/ 347
METRIC RANK
$112,630
HOUSEHOLDER INCOME AGES 45 - 64 YEARS
99.8/ 100
METRIC RATING
54th/ 347
METRIC RANK

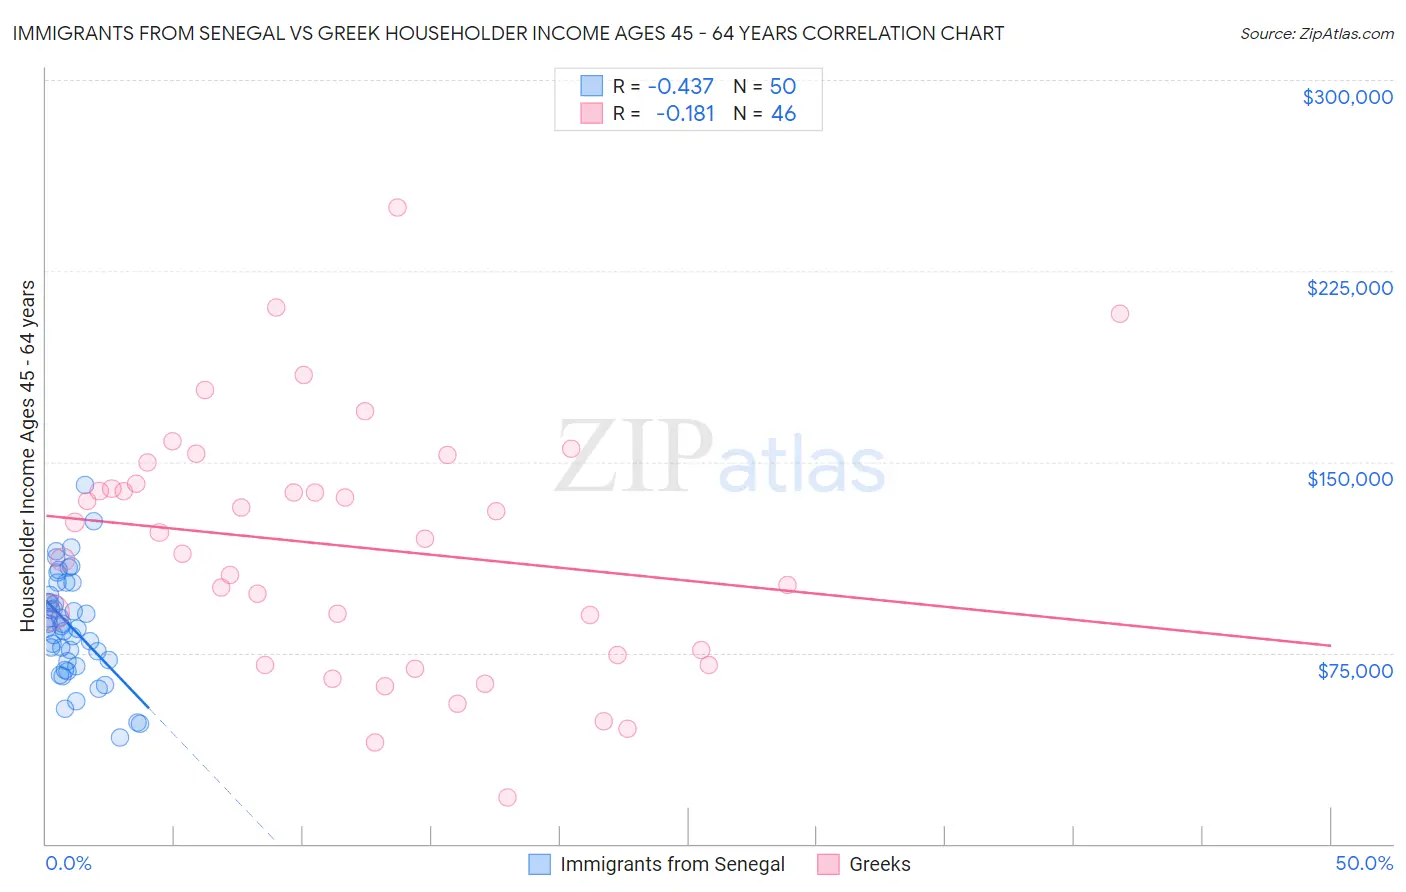
Immigrants from Senegal vs Greek Householder Income Ages 45 - 64 years Correlation Chart

The statistical analysis conducted on geographies consisting of 90,099,692 people shows a moderate negative correlation between the proportion of Immigrants from Senegal and household income with householder between the ages 45 and 64 in the United States with a correlation coefficient (R) of -0.437 and weighted average of $88,421. Similarly, the statistical analysis conducted on geographies consisting of 481,485,565 people shows a poor negative correlation between the proportion of Greeks and household income with householder between the ages 45 and 64 in the United States with a correlation coefficient (R) of -0.181 and weighted average of $112,630, a difference of 27.4%.
Immigrants from Senegal vs Greek Householder Income Ages 45 - 64 years

Householder Income Ages 45 - 64 years Correlation Summary

MeasurementImmigrants from SenegalGreek
Minimum$41,574$18,083
Maximum$140,938$250,001
Range$99,364$231,918
Mean$85,290$116,578
Median$85,076$121,059
Interquartile 25% (IQ1)$71,475$74,375
Interquartile 75% (IQ3)$97,575$141,576
Interquartile Range (IQR)$26,100$67,201
Standard Deviation (Sample)$20,782$49,084
Standard Deviation (Population)$20,574$48,548

Similar Demographics by Householder Income Ages 45 - 64 years

Demographics Similar to Immigrants from Senegal by Householder Income Ages 45 - 64 years

In terms of householder income ages 45 - 64 years, the demographic groups most similar to Immigrants from Senegal are Osage ($88,390, a difference of 0.040%), Jamaican ($88,327, a difference of 0.11%), Somali ($88,600, a difference of 0.20%), Immigrants from West Indies ($88,164, a difference of 0.29%), and Belizean ($88,684, a difference of 0.30%).
DemographicsRating | RankHouseholder Income Ages 45 - 64 years
French American Indians
0.5
/100
|
#256
Tragic
$89,811
German Russians
0.4
/100
|
#257
Tragic
$89,398
Immigrants | Barbados
0.4
/100
|
#258
Tragic
$89,394
Immigrants | Nicaragua
0.4
/100
|
#259
Tragic
$89,108
Liberians
0.3
/100
|
#260
Tragic
$88,929
Belizeans
0.3
/100
|
#261
Tragic
$88,684
Somalis
0.3
/100
|
#262
Tragic
$88,600
Immigrants | Senegal
0.3
/100
|
#263
Tragic
$88,421
Osage
0.3
/100
|
#264
Tragic
$88,390
Jamaicans
0.2
/100
|
#265
Tragic
$88,327
Immigrants | West Indies
0.2
/100
|
#266
Tragic
$88,164
Hmong
0.2
/100
|
#267
Tragic
$88,115
Immigrants | Micronesia
0.2
/100
|
#268
Tragic
$87,864
Spanish Americans
0.2
/100
|
#269
Tragic
$87,836
Immigrants | Liberia
0.2
/100
|
#270
Tragic
$87,739

Demographics Similar to Greeks by Householder Income Ages 45 - 64 years

In terms of householder income ages 45 - 64 years, the demographic groups most similar to Greeks are Afghan ($112,676, a difference of 0.040%), Lithuanian ($112,484, a difference of 0.13%), Immigrants from Malaysia ($112,796, a difference of 0.15%), Immigrants from South Africa ($112,886, a difference of 0.23%), and Egyptian ($112,256, a difference of 0.33%).
DemographicsRating | RankHouseholder Income Ages 45 - 64 years
Australians
99.9
/100
|
#47
Exceptional
$113,533
Immigrants | Indonesia
99.9
/100
|
#48
Exceptional
$113,519
Immigrants | Russia
99.8
/100
|
#49
Exceptional
$113,215
Immigrants | Austria
99.8
/100
|
#50
Exceptional
$113,140
Immigrants | South Africa
99.8
/100
|
#51
Exceptional
$112,886
Immigrants | Malaysia
99.8
/100
|
#52
Exceptional
$112,796
Afghans
99.8
/100
|
#53
Exceptional
$112,676
Greeks
99.8
/100
|
#54
Exceptional
$112,630
Lithuanians
99.8
/100
|
#55
Exceptional
$112,484
Egyptians
99.7
/100
|
#56
Exceptional
$112,256
Immigrants | Scotland
99.7
/100
|
#57
Exceptional
$112,175
Soviet Union
99.7
/100
|
#58
Exceptional
$112,008
Immigrants | Europe
99.7
/100
|
#59
Exceptional
$111,984
Immigrants | Netherlands
99.7
/100
|
#60
Exceptional
$111,982
Immigrants | Czechoslovakia
99.7
/100
|
#61
Exceptional
$111,914