Immigrants from Scotland vs Austrian Median Male Earnings
COMPARE
Immigrants from Scotland
Austrian
Median Male Earnings
Median Male Earnings Comparison
Immigrants from Scotland
Austrians
$61,220
MEDIAN MALE EARNINGS
99.9/ 100
METRIC RATING
57th/ 347
METRIC RANK
$59,359
MEDIAN MALE EARNINGS
99.2/ 100
METRIC RATING
90th/ 347
METRIC RANK
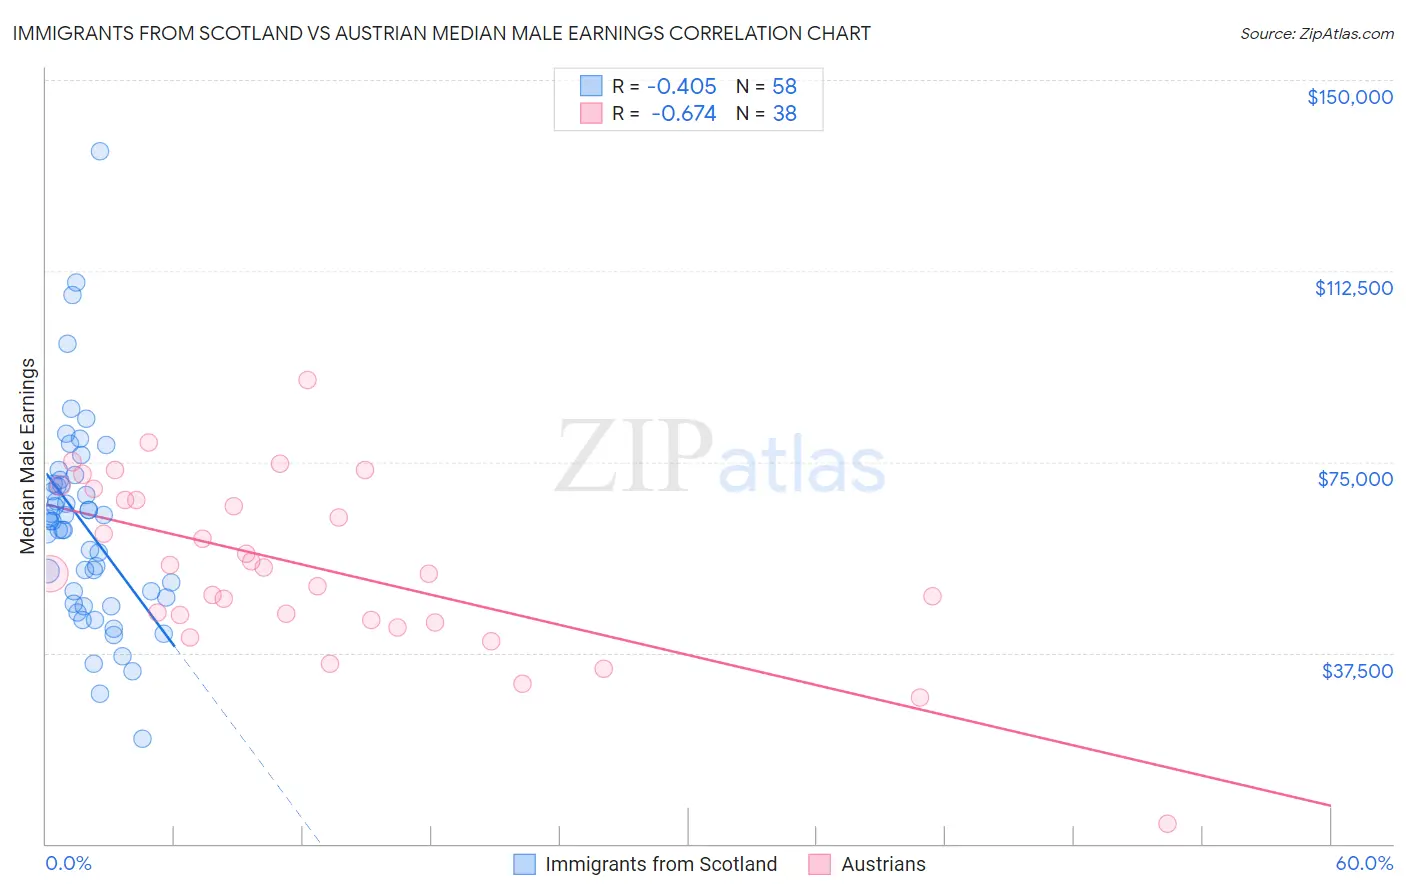
Immigrants from Scotland vs Austrian Median Male Earnings Correlation Chart
The statistical analysis conducted on geographies consisting of 196,362,899 people shows a moderate negative correlation between the proportion of Immigrants from Scotland and median male earnings in the United States with a correlation coefficient (R) of -0.405 and weighted average of $61,220. Similarly, the statistical analysis conducted on geographies consisting of 451,854,520 people shows a significant negative correlation between the proportion of Austrians and median male earnings in the United States with a correlation coefficient (R) of -0.674 and weighted average of $59,359, a difference of 3.1%.
Median Male Earnings Correlation Summary
| Measurement | Immigrants from Scotland | Austrian |
| Minimum | $20,588 | $3,902 |
| Maximum | $136,042 | $91,143 |
| Range | $115,454 | $87,241 |
| Mean | $62,522 | $54,430 |
| Median | $63,347 | $53,632 |
| Interquartile 25% (IQ1) | $48,304 | $43,967 |
| Interquartile 75% (IQ3) | $70,634 | $67,629 |
| Interquartile Range (IQR) | $22,330 | $23,662 |
| Standard Deviation (Sample) | $20,135 | $16,958 |
| Standard Deviation (Population) | $19,960 | $16,734 |
Similar Demographics by Median Male Earnings
Demographics Similar to Immigrants from Scotland by Median Male Earnings
In terms of median male earnings, the demographic groups most similar to Immigrants from Scotland are Lithuanian ($61,228, a difference of 0.010%), New Zealander ($61,199, a difference of 0.030%), Greek ($61,242, a difference of 0.040%), Immigrants from Netherlands ($61,096, a difference of 0.20%), and Egyptian ($61,095, a difference of 0.20%).
| Demographics | Rating | Rank | Median Male Earnings |
| Bhutanese | 99.9 /100 | #50 | Exceptional $61,759 |
| Estonians | 99.9 /100 | #51 | Exceptional $61,710 |
| Immigrants | Norway | 99.9 /100 | #52 | Exceptional $61,628 |
| South Africans | 99.9 /100 | #53 | Exceptional $61,460 |
| Immigrants | Latvia | 99.9 /100 | #54 | Exceptional $61,422 |
| Greeks | 99.9 /100 | #55 | Exceptional $61,242 |
| Lithuanians | 99.9 /100 | #56 | Exceptional $61,228 |
| Immigrants | Scotland | 99.9 /100 | #57 | Exceptional $61,220 |
| New Zealanders | 99.9 /100 | #58 | Exceptional $61,199 |
| Immigrants | Netherlands | 99.8 /100 | #59 | Exceptional $61,096 |
| Egyptians | 99.8 /100 | #60 | Exceptional $61,095 |
| Bolivians | 99.8 /100 | #61 | Exceptional $61,066 |
| Immigrants | Romania | 99.8 /100 | #62 | Exceptional $61,040 |
| Immigrants | Pakistan | 99.8 /100 | #63 | Exceptional $60,987 |
| Immigrants | Eastern Europe | 99.8 /100 | #64 | Exceptional $60,958 |
Demographics Similar to Austrians by Median Male Earnings
In terms of median male earnings, the demographic groups most similar to Austrians are Laotian ($59,351, a difference of 0.010%), Immigrants from Moldova ($59,417, a difference of 0.10%), Immigrants from Kazakhstan ($59,278, a difference of 0.14%), Immigrants from Argentina ($59,491, a difference of 0.22%), and Immigrants from Southern Europe ($59,217, a difference of 0.24%).
| Demographics | Rating | Rank | Median Male Earnings |
| Immigrants | Italy | 99.4 /100 | #83 | Exceptional $59,691 |
| Afghans | 99.3 /100 | #84 | Exceptional $59,554 |
| Italians | 99.3 /100 | #85 | Exceptional $59,551 |
| Immigrants | England | 99.3 /100 | #86 | Exceptional $59,527 |
| Macedonians | 99.3 /100 | #87 | Exceptional $59,522 |
| Immigrants | Argentina | 99.3 /100 | #88 | Exceptional $59,491 |
| Immigrants | Moldova | 99.2 /100 | #89 | Exceptional $59,417 |
| Austrians | 99.2 /100 | #90 | Exceptional $59,359 |
| Laotians | 99.2 /100 | #91 | Exceptional $59,351 |
| Immigrants | Kazakhstan | 99.1 /100 | #92 | Exceptional $59,278 |
| Immigrants | Southern Europe | 99.0 /100 | #93 | Exceptional $59,217 |
| Immigrants | North Macedonia | 99.0 /100 | #94 | Exceptional $59,189 |
| Immigrants | Lebanon | 98.6 /100 | #95 | Exceptional $58,835 |
| Albanians | 98.4 /100 | #96 | Exceptional $58,680 |
| Northern Europeans | 98.2 /100 | #97 | Exceptional $58,588 |