Immigrants from Portugal vs South African Median Female Earnings
COMPARE
Immigrants from Portugal
South African
Median Female Earnings
Median Female Earnings Comparison
Immigrants from Portugal
South Africans
$39,788
MEDIAN FEMALE EARNINGS
54.7/ 100
METRIC RATING
171st/ 347
METRIC RANK
$41,825
MEDIAN FEMALE EARNINGS
98.8/ 100
METRIC RATING
96th/ 347
METRIC RANK
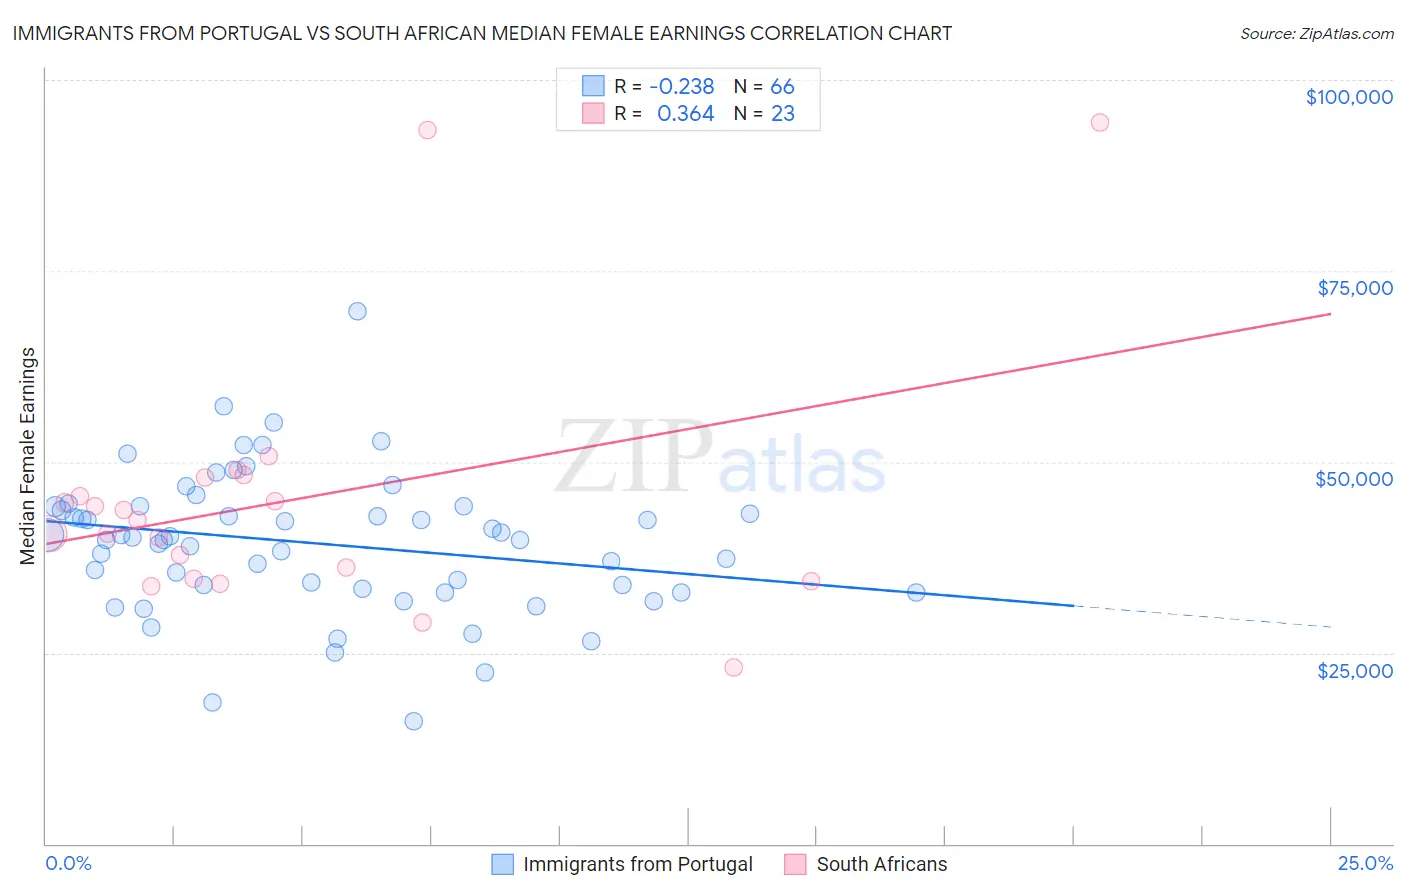
Immigrants from Portugal vs South African Median Female Earnings Correlation Chart
The statistical analysis conducted on geographies consisting of 174,753,972 people shows a weak negative correlation between the proportion of Immigrants from Portugal and median female earnings in the United States with a correlation coefficient (R) of -0.238 and weighted average of $39,788. Similarly, the statistical analysis conducted on geographies consisting of 182,555,636 people shows a mild positive correlation between the proportion of South Africans and median female earnings in the United States with a correlation coefficient (R) of 0.364 and weighted average of $41,825, a difference of 5.1%.
Median Female Earnings Correlation Summary
| Measurement | Immigrants from Portugal | South African |
| Minimum | $15,996 | $23,068 |
| Maximum | $69,732 | $94,510 |
| Range | $53,736 | $71,442 |
| Mean | $39,346 | $44,927 |
| Median | $39,980 | $42,310 |
| Interquartile 25% (IQ1) | $33,451 | $34,713 |
| Interquartile 75% (IQ3) | $44,115 | $47,886 |
| Interquartile Range (IQR) | $10,664 | $13,173 |
| Standard Deviation (Sample) | $9,199 | $16,884 |
| Standard Deviation (Population) | $9,130 | $16,513 |
Similar Demographics by Median Female Earnings
Demographics Similar to Immigrants from Portugal by Median Female Earnings
In terms of median female earnings, the demographic groups most similar to Immigrants from Portugal are British ($39,772, a difference of 0.040%), Slovene ($39,817, a difference of 0.070%), Canadian ($39,724, a difference of 0.16%), Kenyan ($39,860, a difference of 0.18%), and Immigrants from Peru ($39,871, a difference of 0.21%).
| Demographics | Rating | Rank | Median Female Earnings |
| Immigrants | Saudi Arabia | 62.9 /100 | #164 | Good $39,952 |
| Immigrants | Bangladesh | 60.8 /100 | #165 | Good $39,910 |
| Immigrants | Ghana | 60.0 /100 | #166 | Good $39,894 |
| Luxembourgers | 59.9 /100 | #167 | Average $39,891 |
| Immigrants | Peru | 58.9 /100 | #168 | Average $39,871 |
| Kenyans | 58.4 /100 | #169 | Average $39,860 |
| Slovenes | 56.2 /100 | #170 | Average $39,817 |
| Immigrants | Portugal | 54.7 /100 | #171 | Average $39,788 |
| British | 53.8 /100 | #172 | Average $39,772 |
| Canadians | 51.4 /100 | #173 | Average $39,724 |
| South Americans | 50.0 /100 | #174 | Average $39,698 |
| Immigrants | South America | 47.2 /100 | #175 | Average $39,643 |
| Nigerians | 47.0 /100 | #176 | Average $39,641 |
| Costa Ricans | 46.1 /100 | #177 | Average $39,622 |
| Slavs | 45.6 /100 | #178 | Average $39,613 |
Demographics Similar to South Africans by Median Female Earnings
In terms of median female earnings, the demographic groups most similar to South Africans are Immigrants from Hungary ($41,820, a difference of 0.010%), Moroccan ($41,872, a difference of 0.11%), Immigrants from Netherlands ($41,870, a difference of 0.11%), Immigrants from Scotland ($41,771, a difference of 0.13%), and Immigrants from Grenada ($41,932, a difference of 0.26%).
| Demographics | Rating | Rank | Median Female Earnings |
| Immigrants | Afghanistan | 99.3 /100 | #89 | Exceptional $42,055 |
| Ukrainians | 99.2 /100 | #90 | Exceptional $42,015 |
| Immigrants | Western Europe | 99.2 /100 | #91 | Exceptional $41,990 |
| Argentineans | 99.1 /100 | #92 | Exceptional $41,952 |
| Immigrants | Grenada | 99.0 /100 | #93 | Exceptional $41,932 |
| Moroccans | 98.9 /100 | #94 | Exceptional $41,872 |
| Immigrants | Netherlands | 98.9 /100 | #95 | Exceptional $41,870 |
| South Africans | 98.8 /100 | #96 | Exceptional $41,825 |
| Immigrants | Hungary | 98.8 /100 | #97 | Exceptional $41,820 |
| Immigrants | Scotland | 98.7 /100 | #98 | Exceptional $41,771 |
| Immigrants | Barbados | 98.4 /100 | #99 | Exceptional $41,685 |
| Romanians | 98.3 /100 | #100 | Exceptional $41,663 |
| Immigrants | Fiji | 98.3 /100 | #101 | Exceptional $41,656 |
| Immigrants | Poland | 98.2 /100 | #102 | Exceptional $41,630 |
| Immigrants | Argentina | 97.9 /100 | #103 | Exceptional $41,554 |