Immigrants from Philippines vs Slavic Median Male Earnings
COMPARE
Immigrants from Philippines
Slavic
Median Male Earnings
Median Male Earnings Comparison
Immigrants from Philippines
Slavs
$55,809
MEDIAN MALE EARNINGS
78.4/ 100
METRIC RATING
147th/ 347
METRIC RANK
$56,390
MEDIAN MALE EARNINGS
86.5/ 100
METRIC RATING
137th/ 347
METRIC RANK
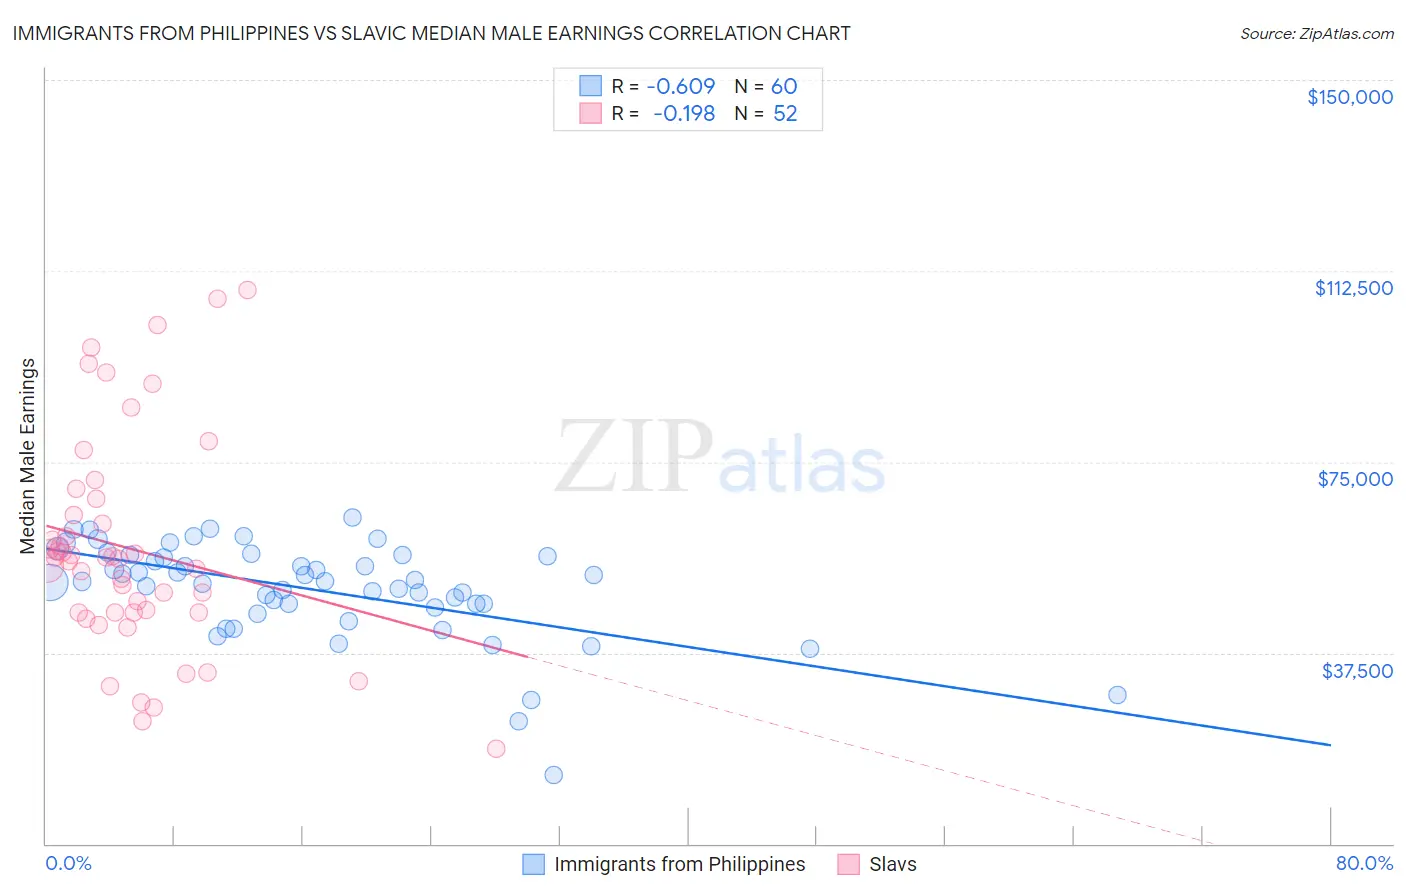
Immigrants from Philippines vs Slavic Median Male Earnings Correlation Chart
The statistical analysis conducted on geographies consisting of 471,105,700 people shows a significant negative correlation between the proportion of Immigrants from Philippines and median male earnings in the United States with a correlation coefficient (R) of -0.609 and weighted average of $55,809. Similarly, the statistical analysis conducted on geographies consisting of 270,818,256 people shows a poor negative correlation between the proportion of Slavs and median male earnings in the United States with a correlation coefficient (R) of -0.198 and weighted average of $56,390, a difference of 1.0%.
Median Male Earnings Correlation Summary
| Measurement | Immigrants from Philippines | Slavic |
| Minimum | $13,438 | $18,676 |
| Maximum | $64,188 | $108,806 |
| Range | $50,750 | $90,130 |
| Mean | $49,896 | $57,922 |
| Median | $51,541 | $56,132 |
| Interquartile 25% (IQ1) | $46,774 | $45,442 |
| Interquartile 75% (IQ3) | $56,545 | $66,210 |
| Interquartile Range (IQR) | $9,771 | $20,768 |
| Standard Deviation (Sample) | $9,645 | $21,311 |
| Standard Deviation (Population) | $9,565 | $21,105 |
Demographics Similar to Immigrants from Philippines and Slavs by Median Male Earnings
In terms of median male earnings, the demographic groups most similar to Immigrants from Philippines are Scottish ($55,793, a difference of 0.030%), English ($55,747, a difference of 0.11%), Swiss ($55,731, a difference of 0.14%), Immigrants from Oceania ($55,712, a difference of 0.17%), and Immigrants from Chile ($55,954, a difference of 0.26%). Similarly, the demographic groups most similar to Slavs are Immigrants from Saudi Arabia ($56,452, a difference of 0.11%), Irish ($56,464, a difference of 0.13%), Slovak ($56,306, a difference of 0.15%), Zimbabwean ($56,302, a difference of 0.16%), and Luxembourger ($56,300, a difference of 0.16%).
| Demographics | Rating | Rank | Median Male Earnings |
| Czechs | 88.2 /100 | #132 | Excellent $56,546 |
| Immigrants | Germany | 88.2 /100 | #133 | Excellent $56,542 |
| Moroccans | 87.7 /100 | #134 | Excellent $56,499 |
| Irish | 87.4 /100 | #135 | Excellent $56,464 |
| Immigrants | Saudi Arabia | 87.2 /100 | #136 | Excellent $56,452 |
| Slavs | 86.5 /100 | #137 | Excellent $56,390 |
| Slovaks | 85.5 /100 | #138 | Excellent $56,306 |
| Zimbabweans | 85.5 /100 | #139 | Excellent $56,302 |
| Luxembourgers | 85.5 /100 | #140 | Excellent $56,300 |
| Danes | 84.8 /100 | #141 | Excellent $56,246 |
| Ethiopians | 84.8 /100 | #142 | Excellent $56,243 |
| Sri Lankans | 83.4 /100 | #143 | Excellent $56,136 |
| Immigrants | Uganda | 82.4 /100 | #144 | Excellent $56,064 |
| Norwegians | 80.9 /100 | #145 | Excellent $55,965 |
| Immigrants | Chile | 80.7 /100 | #146 | Excellent $55,954 |
| Immigrants | Philippines | 78.4 /100 | #147 | Good $55,809 |
| Scottish | 78.2 /100 | #148 | Good $55,793 |
| English | 77.4 /100 | #149 | Good $55,747 |
| Swiss | 77.1 /100 | #150 | Good $55,731 |
| Immigrants | Oceania | 76.8 /100 | #151 | Good $55,712 |
| Peruvians | 75.8 /100 | #152 | Good $55,659 |