Immigrants from Philippines vs Haitian Householder Income Under 25 years
COMPARE
Immigrants from Philippines
Haitian
Householder Income Under 25 years
Householder Income Under 25 years Comparison
Immigrants from Philippines
Haitians
$57,930
HOUSEHOLDER INCOME UNDER 25 YEARS
100.0/ 100
METRIC RATING
12th/ 347
METRIC RANK
$50,231
HOUSEHOLDER INCOME UNDER 25 YEARS
0.8/ 100
METRIC RATING
262nd/ 347
METRIC RANK
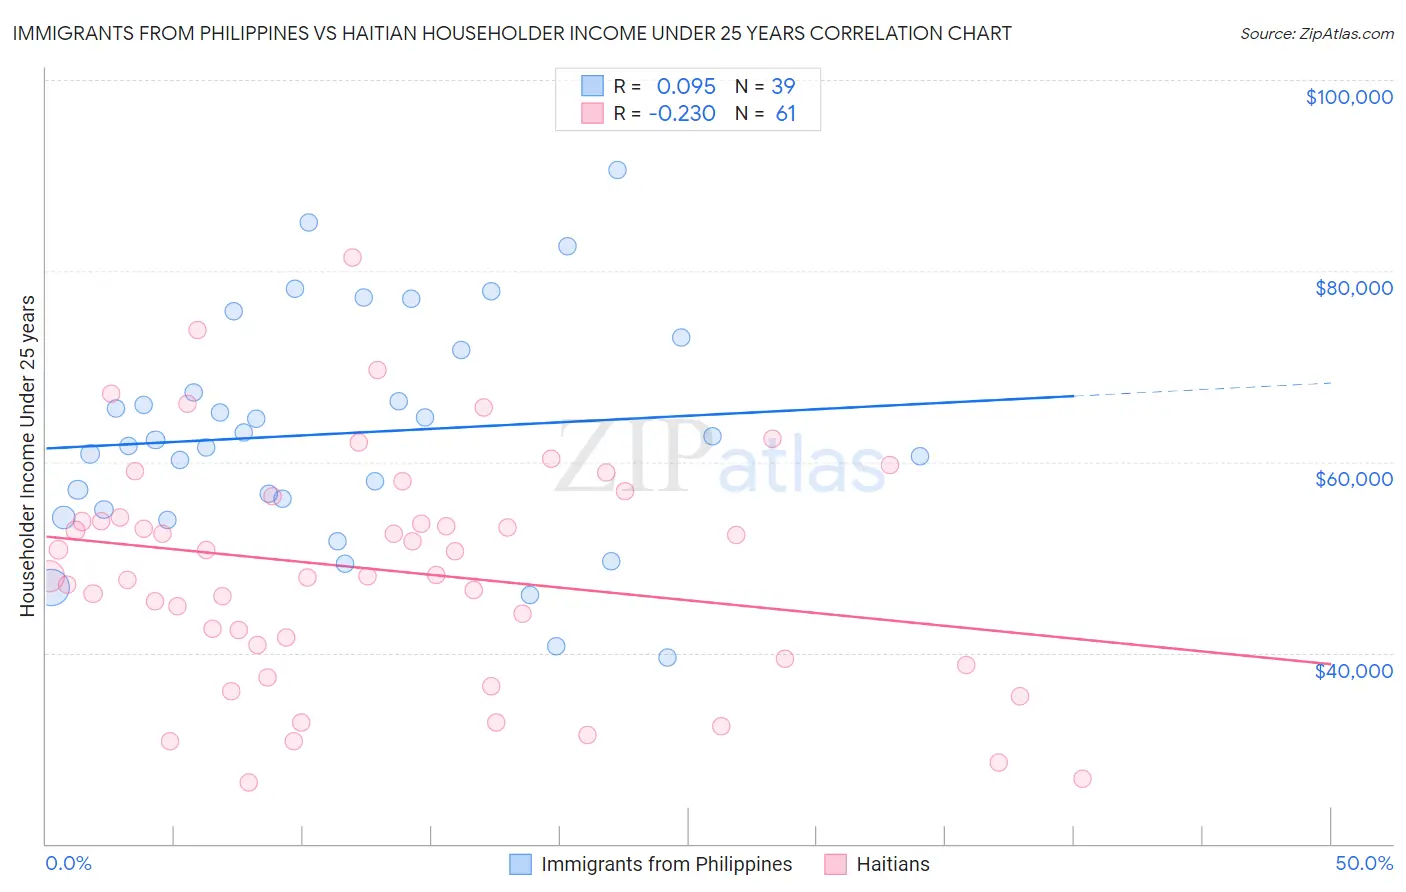
Immigrants from Philippines vs Haitian Householder Income Under 25 years Correlation Chart
The statistical analysis conducted on geographies consisting of 387,978,283 people shows a slight positive correlation between the proportion of Immigrants from Philippines and household income with householder under the age of 25 in the United States with a correlation coefficient (R) of 0.095 and weighted average of $57,930. Similarly, the statistical analysis conducted on geographies consisting of 247,862,749 people shows a weak negative correlation between the proportion of Haitians and household income with householder under the age of 25 in the United States with a correlation coefficient (R) of -0.230 and weighted average of $50,231, a difference of 15.3%.
Householder Income Under 25 years Correlation Summary
| Measurement | Immigrants from Philippines | Haitian |
| Minimum | $39,563 | $26,478 |
| Maximum | $90,625 | $81,415 |
| Range | $51,062 | $54,938 |
| Mean | $62,967 | $48,683 |
| Median | $62,302 | $48,098 |
| Interquartile 25% (IQ1) | $54,996 | $40,094 |
| Interquartile 75% (IQ3) | $71,754 | $55,303 |
| Interquartile Range (IQR) | $16,758 | $15,209 |
| Standard Deviation (Sample) | $11,887 | $11,920 |
| Standard Deviation (Population) | $11,733 | $11,822 |
Similar Demographics by Householder Income Under 25 years
Demographics Similar to Immigrants from Philippines by Householder Income Under 25 years
In terms of householder income under 25 years, the demographic groups most similar to Immigrants from Philippines are Immigrants from China ($57,931, a difference of 0.0%), Afghan ($58,019, a difference of 0.15%), Immigrants from South Central Asia ($57,818, a difference of 0.19%), Filipino ($57,740, a difference of 0.33%), and Korean ($57,730, a difference of 0.35%).
| Demographics | Rating | Rank | Householder Income Under 25 years |
| Immigrants | Bolivia | 100.0 /100 | #5 | Exceptional $59,389 |
| Thais | 100.0 /100 | #6 | Exceptional $59,187 |
| Bolivians | 100.0 /100 | #7 | Exceptional $58,506 |
| Indians (Asian) | 100.0 /100 | #8 | Exceptional $58,239 |
| Chinese | 100.0 /100 | #9 | Exceptional $58,162 |
| Afghans | 100.0 /100 | #10 | Exceptional $58,019 |
| Immigrants | China | 100.0 /100 | #11 | Exceptional $57,931 |
| Immigrants | Philippines | 100.0 /100 | #12 | Exceptional $57,930 |
| Immigrants | South Central Asia | 100.0 /100 | #13 | Exceptional $57,818 |
| Filipinos | 100.0 /100 | #14 | Exceptional $57,740 |
| Koreans | 100.0 /100 | #15 | Exceptional $57,730 |
| Immigrants | Afghanistan | 100.0 /100 | #16 | Exceptional $57,478 |
| Sierra Leoneans | 100.0 /100 | #17 | Exceptional $57,272 |
| Immigrants | Eastern Asia | 100.0 /100 | #18 | Exceptional $57,123 |
| Bhutanese | 100.0 /100 | #19 | Exceptional $57,078 |
Demographics Similar to Haitians by Householder Income Under 25 years
In terms of householder income under 25 years, the demographic groups most similar to Haitians are Hungarian ($50,247, a difference of 0.030%), Immigrants from Dominican Republic ($50,204, a difference of 0.050%), Hispanic or Latino ($50,279, a difference of 0.10%), Immigrants from Dominica ($50,301, a difference of 0.14%), and Fijian ($50,132, a difference of 0.20%).
| Demographics | Rating | Rank | Householder Income Under 25 years |
| Aleuts | 1.2 /100 | #255 | Tragic $50,377 |
| Immigrants | Cuba | 1.2 /100 | #256 | Tragic $50,374 |
| Lebanese | 1.1 /100 | #257 | Tragic $50,355 |
| Whites/Caucasians | 1.1 /100 | #258 | Tragic $50,336 |
| Immigrants | Dominica | 1.0 /100 | #259 | Tragic $50,301 |
| Hispanics or Latinos | 0.9 /100 | #260 | Tragic $50,279 |
| Hungarians | 0.9 /100 | #261 | Tragic $50,247 |
| Haitians | 0.8 /100 | #262 | Tragic $50,231 |
| Immigrants | Dominican Republic | 0.8 /100 | #263 | Tragic $50,204 |
| Fijians | 0.6 /100 | #264 | Tragic $50,132 |
| Belgians | 0.6 /100 | #265 | Tragic $50,113 |
| Immigrants | Venezuela | 0.6 /100 | #266 | Tragic $50,109 |
| Immigrants | Laos | 0.5 /100 | #267 | Tragic $50,041 |
| Venezuelans | 0.5 /100 | #268 | Tragic $50,011 |
| Ute | 0.5 /100 | #269 | Tragic $49,997 |