Immigrants from Peru vs Portuguese Householder Income Under 25 years
COMPARE
Immigrants from Peru
Portuguese
Householder Income Under 25 years
Householder Income Under 25 years Comparison
Immigrants from Peru
Portuguese
$56,384
HOUSEHOLDER INCOME UNDER 25 YEARS
100.0/ 100
METRIC RATING
28th/ 347
METRIC RANK
$54,436
HOUSEHOLDER INCOME UNDER 25 YEARS
99.6/ 100
METRIC RATING
81st/ 347
METRIC RANK
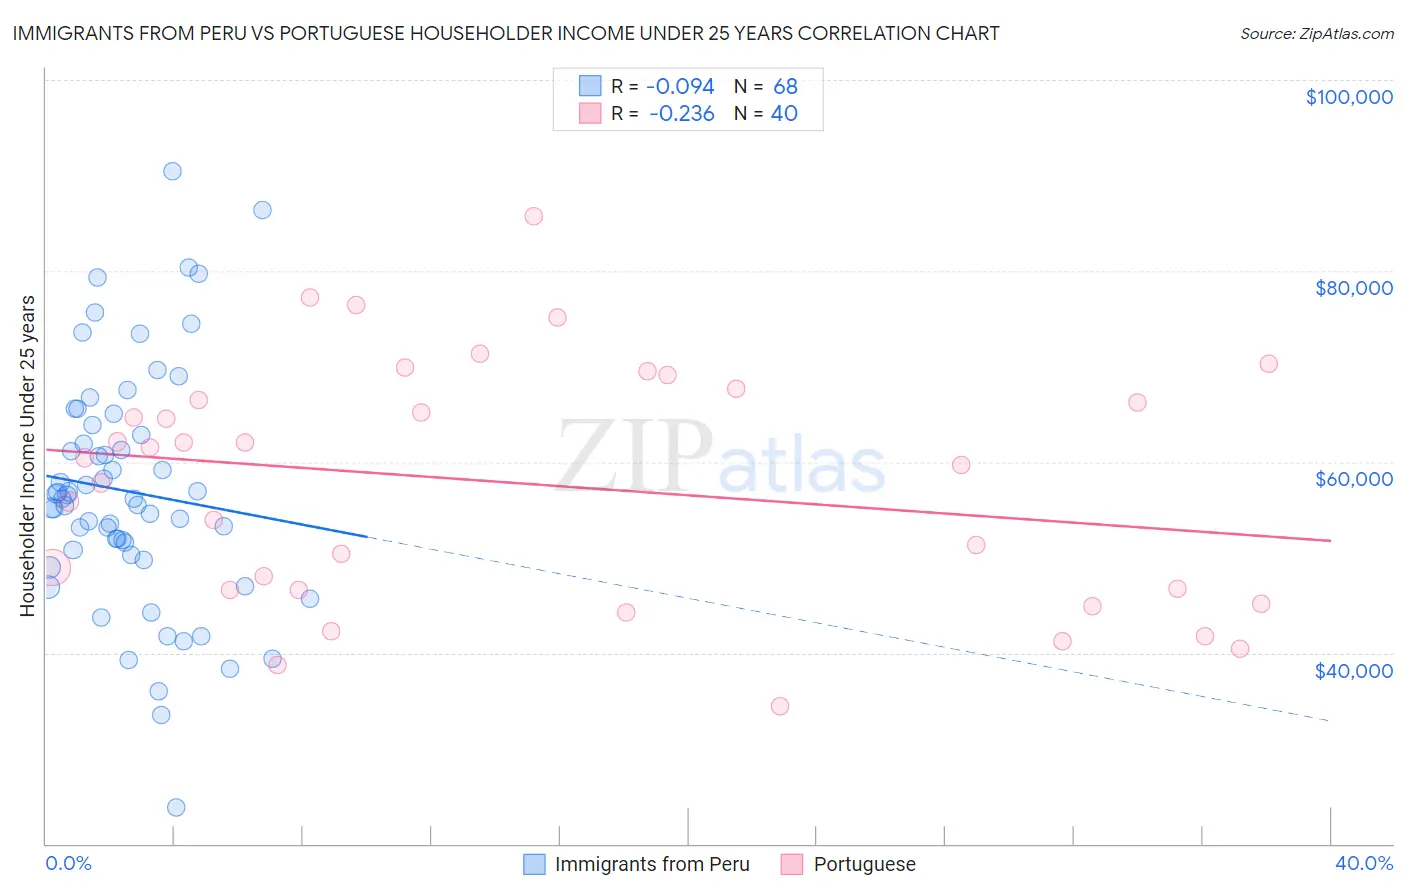
Immigrants from Peru vs Portuguese Householder Income Under 25 years Correlation Chart
The statistical analysis conducted on geographies consisting of 281,649,293 people shows a slight negative correlation between the proportion of Immigrants from Peru and household income with householder under the age of 25 in the United States with a correlation coefficient (R) of -0.094 and weighted average of $56,384. Similarly, the statistical analysis conducted on geographies consisting of 369,014,384 people shows a weak negative correlation between the proportion of Portuguese and household income with householder under the age of 25 in the United States with a correlation coefficient (R) of -0.236 and weighted average of $54,436, a difference of 3.6%.
Householder Income Under 25 years Correlation Summary
| Measurement | Immigrants from Peru | Portuguese |
| Minimum | $23,750 | $34,350 |
| Maximum | $90,496 | $85,677 |
| Range | $66,746 | $51,327 |
| Mean | $56,893 | $57,647 |
| Median | $56,174 | $60,100 |
| Interquartile 25% (IQ1) | $50,499 | $46,553 |
| Interquartile 75% (IQ3) | $63,350 | $67,025 |
| Interquartile Range (IQR) | $12,851 | $20,472 |
| Standard Deviation (Sample) | $12,520 | $12,592 |
| Standard Deviation (Population) | $12,427 | $12,434 |
Similar Demographics by Householder Income Under 25 years
Demographics Similar to Immigrants from Peru by Householder Income Under 25 years
In terms of householder income under 25 years, the demographic groups most similar to Immigrants from Peru are Immigrants from Asia ($56,379, a difference of 0.010%), Immigrants from North Macedonia ($56,503, a difference of 0.21%), Immigrants from Moldova ($56,168, a difference of 0.38%), Vietnamese ($56,127, a difference of 0.46%), and Immigrants from Australia ($56,660, a difference of 0.49%).
| Demographics | Rating | Rank | Householder Income Under 25 years |
| Immigrants | Fiji | 100.0 /100 | #21 | Exceptional $57,074 |
| Asians | 100.0 /100 | #22 | Exceptional $57,003 |
| Tongans | 100.0 /100 | #23 | Exceptional $56,972 |
| Immigrants | Singapore | 100.0 /100 | #24 | Exceptional $56,835 |
| Immigrants | Pakistan | 100.0 /100 | #25 | Exceptional $56,789 |
| Immigrants | Australia | 100.0 /100 | #26 | Exceptional $56,660 |
| Immigrants | North Macedonia | 100.0 /100 | #27 | Exceptional $56,503 |
| Immigrants | Peru | 100.0 /100 | #28 | Exceptional $56,384 |
| Immigrants | Asia | 100.0 /100 | #29 | Exceptional $56,379 |
| Immigrants | Moldova | 100.0 /100 | #30 | Exceptional $56,168 |
| Vietnamese | 100.0 /100 | #31 | Exceptional $56,127 |
| Peruvians | 100.0 /100 | #32 | Exceptional $56,052 |
| Inupiat | 100.0 /100 | #33 | Exceptional $55,935 |
| Immigrants | Japan | 100.0 /100 | #34 | Exceptional $55,932 |
| Tlingit-Haida | 100.0 /100 | #35 | Exceptional $55,914 |
Demographics Similar to Portuguese by Householder Income Under 25 years
In terms of householder income under 25 years, the demographic groups most similar to Portuguese are Egyptian ($54,444, a difference of 0.010%), Immigrants from Italy ($54,449, a difference of 0.020%), Nepalese ($54,472, a difference of 0.060%), Immigrants from Brazil ($54,487, a difference of 0.090%), and Immigrants from Southern Europe ($54,484, a difference of 0.090%).
| Demographics | Rating | Rank | Householder Income Under 25 years |
| Immigrants | Grenada | 99.7 /100 | #74 | Exceptional $54,538 |
| Immigrants | Sri Lanka | 99.7 /100 | #75 | Exceptional $54,512 |
| Immigrants | Brazil | 99.6 /100 | #76 | Exceptional $54,487 |
| Immigrants | Southern Europe | 99.6 /100 | #77 | Exceptional $54,484 |
| Nepalese | 99.6 /100 | #78 | Exceptional $54,472 |
| Immigrants | Italy | 99.6 /100 | #79 | Exceptional $54,449 |
| Egyptians | 99.6 /100 | #80 | Exceptional $54,444 |
| Portuguese | 99.6 /100 | #81 | Exceptional $54,436 |
| Russians | 99.5 /100 | #82 | Exceptional $54,389 |
| Laotians | 99.5 /100 | #83 | Exceptional $54,369 |
| Bulgarians | 99.5 /100 | #84 | Exceptional $54,352 |
| Immigrants | Czechoslovakia | 99.5 /100 | #85 | Exceptional $54,352 |
| Immigrants | Croatia | 99.5 /100 | #86 | Exceptional $54,343 |
| Brazilians | 99.5 /100 | #87 | Exceptional $54,335 |
| Yakama | 99.5 /100 | #88 | Exceptional $54,321 |