Immigrants from Peru vs Immigrants from Saudi Arabia Median Male Earnings
COMPARE
Immigrants from Peru
Immigrants from Saudi Arabia
Median Male Earnings
Median Male Earnings Comparison
Immigrants from Peru
Immigrants from Saudi Arabia
$54,695
MEDIAN MALE EARNINGS
54.9/ 100
METRIC RATING
171st/ 347
METRIC RANK
$56,452
MEDIAN MALE EARNINGS
87.2/ 100
METRIC RATING
136th/ 347
METRIC RANK
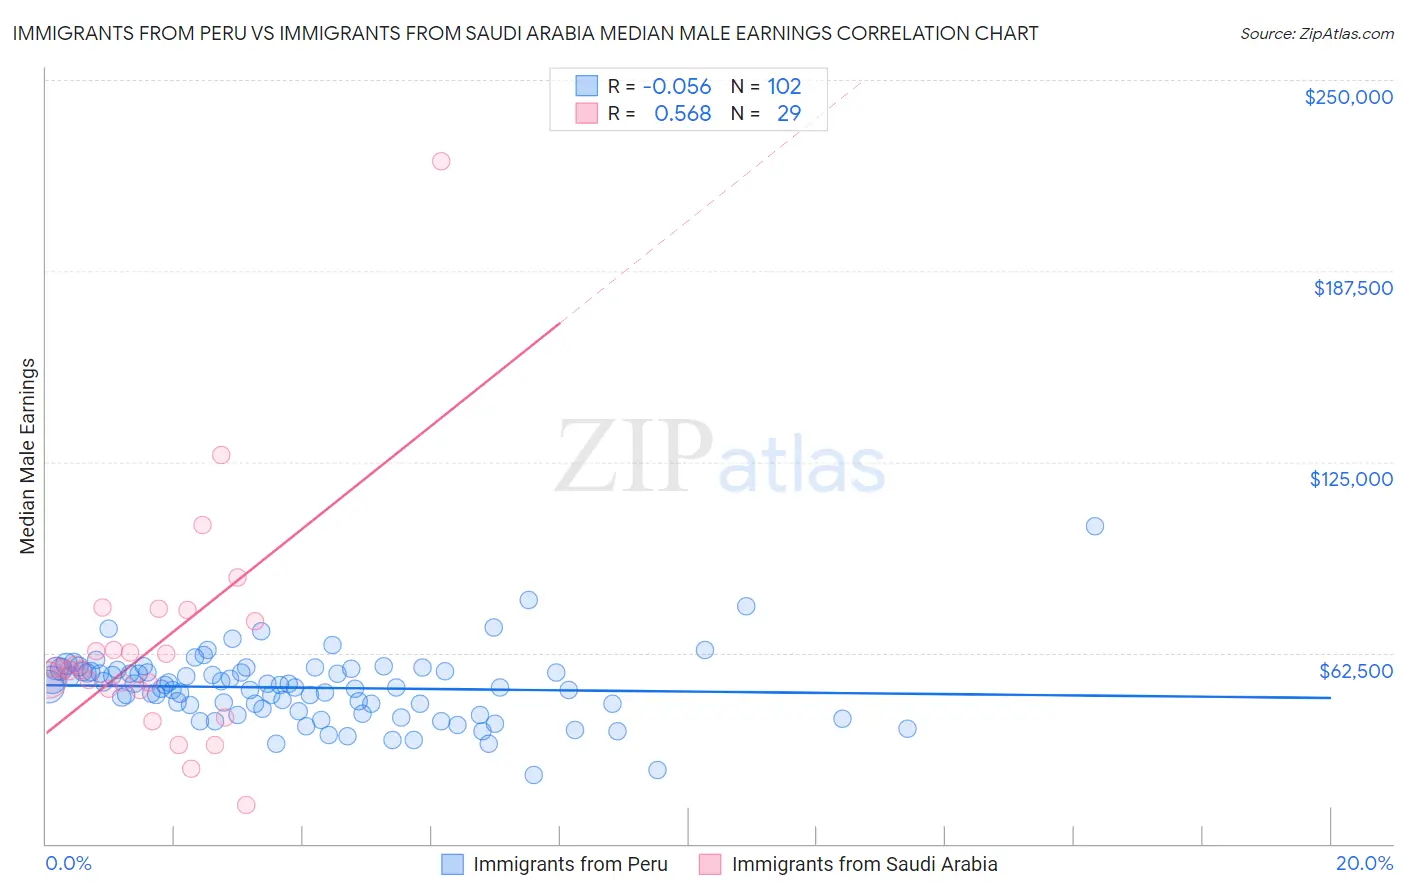
Immigrants from Peru vs Immigrants from Saudi Arabia Median Male Earnings Correlation Chart
The statistical analysis conducted on geographies consisting of 328,805,303 people shows a slight negative correlation between the proportion of Immigrants from Peru and median male earnings in the United States with a correlation coefficient (R) of -0.056 and weighted average of $54,695. Similarly, the statistical analysis conducted on geographies consisting of 164,293,936 people shows a substantial positive correlation between the proportion of Immigrants from Saudi Arabia and median male earnings in the United States with a correlation coefficient (R) of 0.568 and weighted average of $56,452, a difference of 3.2%.
Median Male Earnings Correlation Summary
| Measurement | Immigrants from Peru | Immigrants from Saudi Arabia |
| Minimum | $22,560 | $12,696 |
| Maximum | $104,038 | $223,261 |
| Range | $81,478 | $210,565 |
| Mean | $51,057 | $64,851 |
| Median | $51,289 | $57,085 |
| Interquartile 25% (IQ1) | $44,299 | $50,362 |
| Interquartile 75% (IQ3) | $56,461 | $74,807 |
| Interquartile Range (IQR) | $12,162 | $24,445 |
| Standard Deviation (Sample) | $11,444 | $38,008 |
| Standard Deviation (Population) | $11,388 | $37,347 |
Similar Demographics by Median Male Earnings
Demographics Similar to Immigrants from Peru by Median Male Earnings
In terms of median male earnings, the demographic groups most similar to Immigrants from Peru are French Canadian ($54,722, a difference of 0.050%), Finnish ($54,721, a difference of 0.050%), Welsh ($54,647, a difference of 0.090%), South American Indian ($54,508, a difference of 0.34%), and South American ($54,492, a difference of 0.37%).
| Demographics | Rating | Rank | Median Male Earnings |
| Immigrants | South Eastern Asia | 67.6 /100 | #164 | Good $55,241 |
| Immigrants | Portugal | 66.3 /100 | #165 | Good $55,182 |
| Germans | 61.6 /100 | #166 | Good $54,974 |
| Immigrants | Fiji | 61.2 /100 | #167 | Good $54,958 |
| Immigrants | Vietnam | 60.2 /100 | #168 | Good $54,913 |
| French Canadians | 55.6 /100 | #169 | Average $54,722 |
| Finns | 55.6 /100 | #170 | Average $54,721 |
| Immigrants | Peru | 54.9 /100 | #171 | Average $54,695 |
| Welsh | 53.8 /100 | #172 | Average $54,647 |
| South American Indians | 50.4 /100 | #173 | Average $54,508 |
| South Americans | 50.0 /100 | #174 | Average $54,492 |
| Dutch | 48.0 /100 | #175 | Average $54,410 |
| Spaniards | 47.8 /100 | #176 | Average $54,401 |
| Costa Ricans | 44.8 /100 | #177 | Average $54,279 |
| Sierra Leoneans | 44.8 /100 | #178 | Average $54,279 |
Demographics Similar to Immigrants from Saudi Arabia by Median Male Earnings
In terms of median male earnings, the demographic groups most similar to Immigrants from Saudi Arabia are Irish ($56,464, a difference of 0.020%), Moroccan ($56,499, a difference of 0.080%), Slavic ($56,390, a difference of 0.11%), Immigrants from Germany ($56,542, a difference of 0.16%), and Czech ($56,546, a difference of 0.17%).
| Demographics | Rating | Rank | Median Male Earnings |
| Pakistanis | 89.9 /100 | #129 | Excellent $56,719 |
| Koreans | 89.4 /100 | #130 | Excellent $56,672 |
| Portuguese | 89.4 /100 | #131 | Excellent $56,663 |
| Czechs | 88.2 /100 | #132 | Excellent $56,546 |
| Immigrants | Germany | 88.2 /100 | #133 | Excellent $56,542 |
| Moroccans | 87.7 /100 | #134 | Excellent $56,499 |
| Irish | 87.4 /100 | #135 | Excellent $56,464 |
| Immigrants | Saudi Arabia | 87.2 /100 | #136 | Excellent $56,452 |
| Slavs | 86.5 /100 | #137 | Excellent $56,390 |
| Slovaks | 85.5 /100 | #138 | Excellent $56,306 |
| Zimbabweans | 85.5 /100 | #139 | Excellent $56,302 |
| Luxembourgers | 85.5 /100 | #140 | Excellent $56,300 |
| Danes | 84.8 /100 | #141 | Excellent $56,246 |
| Ethiopians | 84.8 /100 | #142 | Excellent $56,243 |
| Sri Lankans | 83.4 /100 | #143 | Excellent $56,136 |