Immigrants from Peru vs Hungarian Median Household Income
COMPARE
Immigrants from Peru
Hungarian
Median Household Income
Median Household Income Comparison
Immigrants from Peru
Hungarians
$89,010
MEDIAN HOUSEHOLD INCOME
92.5/ 100
METRIC RATING
127th/ 347
METRIC RANK
$86,920
MEDIAN HOUSEHOLD INCOME
76.3/ 100
METRIC RATING
151st/ 347
METRIC RANK
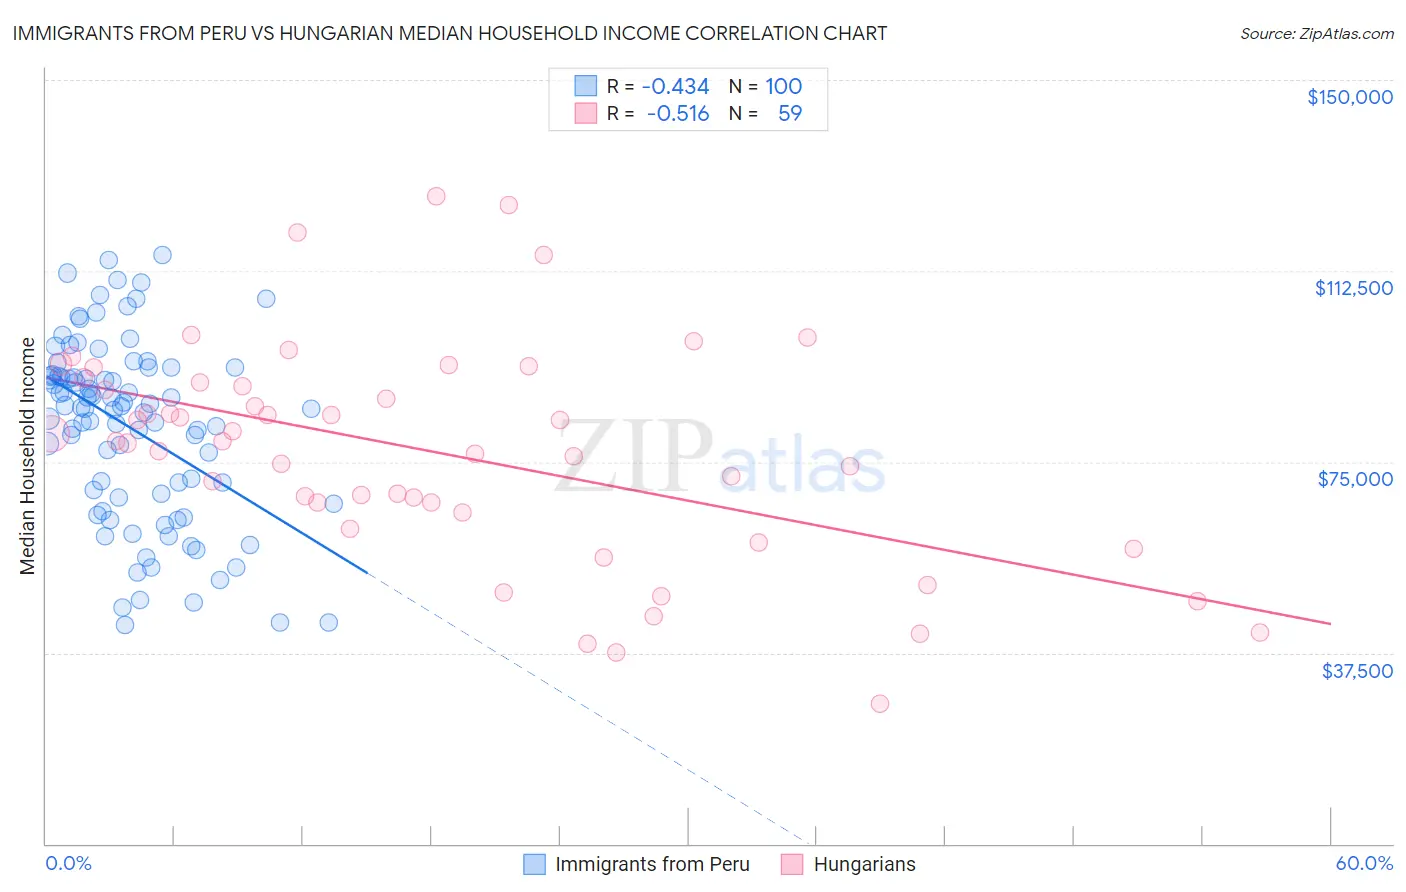
Immigrants from Peru vs Hungarian Median Household Income Correlation Chart
The statistical analysis conducted on geographies consisting of 328,713,942 people shows a moderate negative correlation between the proportion of Immigrants from Peru and median household income in the United States with a correlation coefficient (R) of -0.434 and weighted average of $89,010. Similarly, the statistical analysis conducted on geographies consisting of 485,741,386 people shows a substantial negative correlation between the proportion of Hungarians and median household income in the United States with a correlation coefficient (R) of -0.516 and weighted average of $86,920, a difference of 2.4%.
Median Household Income Correlation Summary
| Measurement | Immigrants from Peru | Hungarian |
| Minimum | $42,917 | $27,488 |
| Maximum | $115,592 | $127,161 |
| Range | $72,675 | $99,673 |
| Mean | $81,696 | $76,828 |
| Median | $85,578 | $79,103 |
| Interquartile 25% (IQ1) | $68,327 | $65,060 |
| Interquartile 75% (IQ3) | $91,955 | $90,559 |
| Interquartile Range (IQR) | $23,628 | $25,499 |
| Standard Deviation (Sample) | $17,705 | $21,600 |
| Standard Deviation (Population) | $17,616 | $21,417 |
Similar Demographics by Median Household Income
Demographics Similar to Immigrants from Peru by Median Household Income
In terms of median household income, the demographic groups most similar to Immigrants from Peru are Portuguese ($88,976, a difference of 0.040%), Brazilian ($88,934, a difference of 0.090%), Immigrants from Oceania ($89,100, a difference of 0.10%), British ($88,914, a difference of 0.11%), and Immigrants from Syria ($88,792, a difference of 0.25%).
| Demographics | Rating | Rank | Median Household Income |
| Immigrants | North Macedonia | 95.2 /100 | #120 | Exceptional $89,741 |
| Ethiopians | 94.9 /100 | #121 | Exceptional $89,640 |
| Pakistanis | 94.8 /100 | #122 | Exceptional $89,638 |
| Immigrants | Zimbabwe | 94.4 /100 | #123 | Exceptional $89,496 |
| Immigrants | Jordan | 94.1 /100 | #124 | Exceptional $89,412 |
| Immigrants | Kuwait | 93.5 /100 | #125 | Exceptional $89,263 |
| Immigrants | Oceania | 92.9 /100 | #126 | Exceptional $89,100 |
| Immigrants | Peru | 92.5 /100 | #127 | Exceptional $89,010 |
| Portuguese | 92.3 /100 | #128 | Exceptional $88,976 |
| Brazilians | 92.1 /100 | #129 | Exceptional $88,934 |
| British | 92.0 /100 | #130 | Exceptional $88,914 |
| Immigrants | Syria | 91.4 /100 | #131 | Exceptional $88,792 |
| Europeans | 91.2 /100 | #132 | Exceptional $88,751 |
| Immigrants | Ethiopia | 90.9 /100 | #133 | Exceptional $88,687 |
| Swedes | 90.0 /100 | #134 | Exceptional $88,524 |
Demographics Similar to Hungarians by Median Household Income
In terms of median household income, the demographic groups most similar to Hungarians are Immigrants from Saudi Arabia ($86,875, a difference of 0.050%), Basque ($87,001, a difference of 0.090%), South American ($86,824, a difference of 0.11%), Immigrants from Nepal ($87,046, a difference of 0.15%), and Immigrants from Germany ($86,764, a difference of 0.18%).
| Demographics | Rating | Rank | Median Household Income |
| Serbians | 83.0 /100 | #144 | Excellent $87,572 |
| Ugandans | 82.9 /100 | #145 | Excellent $87,557 |
| Immigrants | Uganda | 82.8 /100 | #146 | Excellent $87,553 |
| South American Indians | 81.8 /100 | #147 | Excellent $87,446 |
| Costa Ricans | 80.0 /100 | #148 | Excellent $87,262 |
| Immigrants | Nepal | 77.7 /100 | #149 | Good $87,046 |
| Basques | 77.2 /100 | #150 | Good $87,001 |
| Hungarians | 76.3 /100 | #151 | Good $86,920 |
| Immigrants | Saudi Arabia | 75.8 /100 | #152 | Good $86,875 |
| South Americans | 75.1 /100 | #153 | Good $86,824 |
| Immigrants | Germany | 74.4 /100 | #154 | Good $86,764 |
| Carpatho Rusyns | 72.8 /100 | #155 | Good $86,635 |
| Immigrants | Albania | 71.5 /100 | #156 | Good $86,534 |
| Samoans | 71.0 /100 | #157 | Good $86,498 |
| Moroccans | 70.6 /100 | #158 | Good $86,468 |