Immigrants from Peru vs Bermudan Median Female Earnings
COMPARE
Immigrants from Peru
Bermudan
Median Female Earnings
Median Female Earnings Comparison
Immigrants from Peru
Bermudans
$39,871
MEDIAN FEMALE EARNINGS
58.9/ 100
METRIC RATING
168th/ 347
METRIC RANK
$39,418
MEDIAN FEMALE EARNINGS
35.9/ 100
METRIC RATING
188th/ 347
METRIC RANK
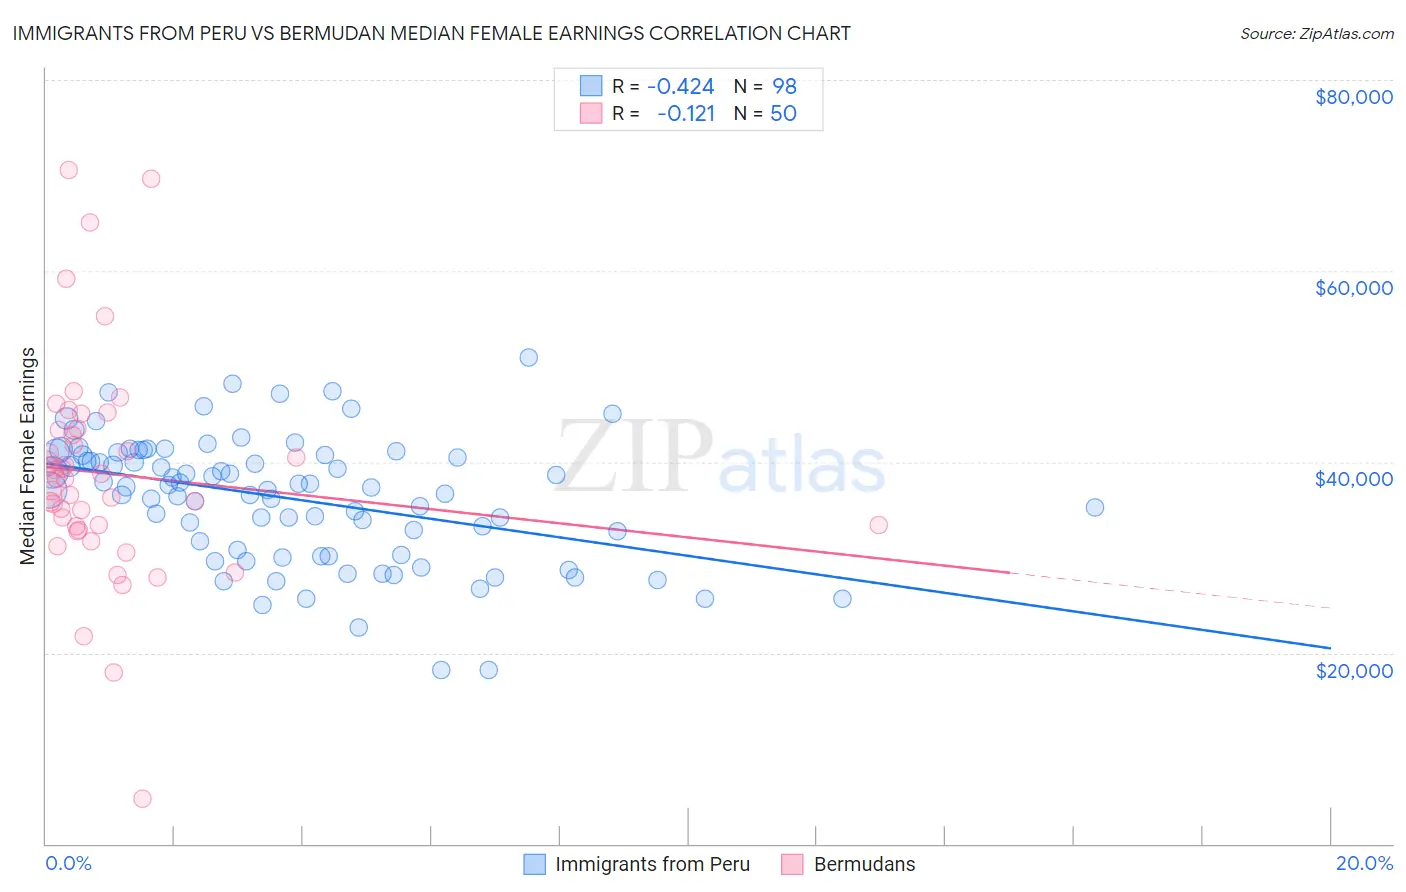
Immigrants from Peru vs Bermudan Median Female Earnings Correlation Chart
The statistical analysis conducted on geographies consisting of 328,788,415 people shows a moderate negative correlation between the proportion of Immigrants from Peru and median female earnings in the United States with a correlation coefficient (R) of -0.424 and weighted average of $39,871. Similarly, the statistical analysis conducted on geographies consisting of 55,724,642 people shows a poor negative correlation between the proportion of Bermudans and median female earnings in the United States with a correlation coefficient (R) of -0.121 and weighted average of $39,418, a difference of 1.1%.
Median Female Earnings Correlation Summary
| Measurement | Immigrants from Peru | Bermudan |
| Minimum | $18,150 | $4,682 |
| Maximum | $50,975 | $70,590 |
| Range | $32,825 | $65,908 |
| Mean | $36,171 | $38,764 |
| Median | $37,366 | $38,256 |
| Interquartile 25% (IQ1) | $30,816 | $33,240 |
| Interquartile 75% (IQ3) | $40,742 | $43,282 |
| Interquartile Range (IQR) | $9,926 | $10,042 |
| Standard Deviation (Sample) | $6,551 | $11,556 |
| Standard Deviation (Population) | $6,517 | $11,440 |
Demographics Similar to Immigrants from Peru and Bermudans by Median Female Earnings
In terms of median female earnings, the demographic groups most similar to Immigrants from Peru are Kenyan ($39,860, a difference of 0.030%), Slovene ($39,817, a difference of 0.13%), Immigrants from Portugal ($39,788, a difference of 0.21%), British ($39,772, a difference of 0.25%), and Canadian ($39,724, a difference of 0.37%). Similarly, the demographic groups most similar to Bermudans are Swedish ($39,421, a difference of 0.010%), Colombian ($39,439, a difference of 0.050%), Immigrants from West Indies ($39,441, a difference of 0.060%), European ($39,457, a difference of 0.10%), and Hungarian ($39,510, a difference of 0.23%).
| Demographics | Rating | Rank | Median Female Earnings |
| Immigrants | Peru | 58.9 /100 | #168 | Average $39,871 |
| Kenyans | 58.4 /100 | #169 | Average $39,860 |
| Slovenes | 56.2 /100 | #170 | Average $39,817 |
| Immigrants | Portugal | 54.7 /100 | #171 | Average $39,788 |
| British | 53.8 /100 | #172 | Average $39,772 |
| Canadians | 51.4 /100 | #173 | Average $39,724 |
| South Americans | 50.0 /100 | #174 | Average $39,698 |
| Immigrants | South America | 47.2 /100 | #175 | Average $39,643 |
| Nigerians | 47.0 /100 | #176 | Average $39,641 |
| Costa Ricans | 46.1 /100 | #177 | Average $39,622 |
| Slavs | 45.6 /100 | #178 | Average $39,613 |
| Immigrants | Germany | 45.1 /100 | #179 | Average $39,603 |
| Immigrants | Kenya | 41.6 /100 | #180 | Average $39,535 |
| Tsimshian | 41.4 /100 | #181 | Average $39,530 |
| Tlingit-Haida | 40.5 /100 | #182 | Average $39,513 |
| Hungarians | 40.3 /100 | #183 | Average $39,510 |
| Europeans | 37.7 /100 | #184 | Fair $39,457 |
| Immigrants | West Indies | 36.9 /100 | #185 | Fair $39,441 |
| Colombians | 36.9 /100 | #186 | Fair $39,439 |
| Swedes | 36.0 /100 | #187 | Fair $39,421 |
| Bermudans | 35.9 /100 | #188 | Fair $39,418 |