Immigrants from Panama vs Immigrants from Cuba Per Capita Income

COMPARE

Immigrants from Panama
Race
Ancestry
AfghanAfricanAlaska NativeAlaskan AthabascanAlbanianAleutAlsatianAmericanApacheArabArapahoArgentineanArmenianAssyrian/Chaldean/SyriacAustralianAustrianBahamianBangladeshiBarbadianBasqueBelgianBelizeanBermudanBhutaneseBlackfeetBolivianBrazilianBritishBritish West IndianBulgarianBurmeseCajunCambodianCanadianCape VerdeanCarpatho RusynCelticCentral AmericanCentral American IndianCherokeeCheyenneChickasawChileanChineseChippewaChoctawColombianColvilleComancheCosta RicanCreeCreekCroatianCrowCubanCypriotCzechCzechoslovakianDanishDelawareDominicanDutchDutch West IndianEastern EuropeanEcuadorianEgyptianEnglishEstonianEthiopianEuropeanFijianFilipinoFinnishFrenchFrench American IndianFrench CanadianGermanGerman RussianGhanaianGreekGuamanian/ChamorroGuatemalanGuyaneseHaitianHmongHonduranHopiHoumaHungarianIcelanderIndian (Asian)IndonesianInupiatIranianIraqiIrishIroquoisIsraeliItalianJamaicanJapaneseJordanianKenyanKiowaKoreanLaotianLatvianLebaneseLiberianLithuanianLumbeeLuxembourgerMacedonianMalaysianMalteseMarshalleseMenomineeMexicanMexican American IndianMongolianMoroccanNative HawaiianNavajoNepaleseNew ZealanderNicaraguanNigerianNorthern EuropeanNorwegianOkinawanOsageOttawaPaiutePakistaniPalestinianPanamanianParaguayanPennsylvania GermanPeruvianPimaPolishPortuguesePotawatomiPuebloPuerto RicanPuget Sound SalishRomanianRussianSalvadoranSamoanScandinavianScotch-IrishScottishSeminoleSenegaleseSerbianShoshoneSierra LeoneanSiouxSlavicSlovakSloveneSomaliSouth AfricanSouth AmericanSouth American IndianSoviet UnionSpaniardSpanishSpanish AmericanSpanish American IndianSri LankanSubsaharan AfricanSudaneseSwedishSwissSyrianTaiwaneseThaiTlingit-HaidaTohono O'OdhamTonganTrinidadian and TobagonianTsimshianTurkishU.S. Virgin IslanderUgandanUkrainianUruguayanUteVenezuelanVietnameseWelshWest IndianYakamaYaquiYugoslavianYumanYup'ikZimbabwean
Immigration
NonimmigrantsImmigrantsAfghanistanAfricaAlbaniaArgentinaArmeniaAsiaAustraliaAustriaBahamasBangladeshBarbadosBelarusBelgiumBelizeBoliviaBosnia and HerzegovinaBrazilBulgariaBurma/MyanmarCabo VerdeCambodiaCameroonCanadaCaribbeanCentral AmericaChileChinaColombiaCongoCosta RicaCroatiaCzechoslovakiaDenmarkDominicaDominican RepublicEastern AfricaEastern AsiaEastern EuropeEcuadorEgyptEl SalvadorEnglandEritreaEthiopiaEuropeFijiFranceGermanyGhanaGreeceGrenadaGuatemalaGuyanaHaitiHondurasHong KongHungaryIndiaIndonesiaIranIraqIrelandIsraelItalyJamaicaJapanJordanKazakhstanKenyaKoreaKuwaitLaosLatin AmericaLatviaLebanonLiberiaLithuaniaMalaysiaMexicoMicronesiaMiddle AfricaMoldovaMoroccoNepalNetherlandsNicaraguaNigeriaNorth AmericaNorth MacedoniaNorthern AfricaNorthern EuropeNorwayOceaniaPakistanPanamaPeruPhilippinesPolandPortugalRomaniaRussiaSaudi ArabiaScotlandSenegalSerbiaSierra LeoneSingaporeSomaliaSouth AfricaSouth AmericaSouth Central AsiaSouth Eastern AsiaSouthern EuropeSpainSri LankaSt. Vincent and the GrenadinesSudanSwedenSwitzerlandSyriaTaiwanThailandTrinidad and TobagoTurkeyUgandaUkraineUruguayUzbekistanVenezuelaVietnamWest IndiesWestern AfricaWestern AsiaWestern EuropeYemenZaireZimbabweAzores
Immigrants from Cuba
Race
Ancestry
AfghanAfricanAlaska NativeAlaskan AthabascanAlbanianAleutAlsatianAmericanApacheArabArapahoArgentineanArmenianAssyrian/Chaldean/SyriacAustralianAustrianBahamianBangladeshiBarbadianBasqueBelgianBelizeanBermudanBhutaneseBlackfeetBolivianBrazilianBritishBritish West IndianBulgarianBurmeseCajunCambodianCanadianCape VerdeanCarpatho RusynCelticCentral AmericanCentral American IndianCherokeeCheyenneChickasawChileanChineseChippewaChoctawColombianColvilleComancheCosta RicanCreeCreekCroatianCrowCubanCypriotCzechCzechoslovakianDanishDelawareDominicanDutchDutch West IndianEastern EuropeanEcuadorianEgyptianEnglishEstonianEthiopianEuropeanFijianFilipinoFinnishFrenchFrench American IndianFrench CanadianGermanGerman RussianGhanaianGreekGuamanian/ChamorroGuatemalanGuyaneseHaitianHmongHonduranHopiHoumaHungarianIcelanderIndian (Asian)IndonesianInupiatIranianIraqiIrishIroquoisIsraeliItalianJamaicanJapaneseJordanianKenyanKiowaKoreanLaotianLatvianLebaneseLiberianLithuanianLumbeeLuxembourgerMacedonianMalaysianMalteseMarshalleseMenomineeMexicanMexican American IndianMongolianMoroccanNative HawaiianNavajoNepaleseNew ZealanderNicaraguanNigerianNorthern EuropeanNorwegianOkinawanOsageOttawaPaiutePakistaniPalestinianPanamanianParaguayanPennsylvania GermanPeruvianPimaPolishPortuguesePotawatomiPuebloPuerto RicanPuget Sound SalishRomanianRussianSalvadoranSamoanScandinavianScotch-IrishScottishSeminoleSenegaleseSerbianShoshoneSierra LeoneanSiouxSlavicSlovakSloveneSomaliSouth AfricanSouth AmericanSouth American IndianSoviet UnionSpaniardSpanishSpanish AmericanSpanish American IndianSri LankanSubsaharan AfricanSudaneseSwedishSwissSyrianTaiwaneseThaiTlingit-HaidaTohono O'OdhamTonganTrinidadian and TobagonianTsimshianTurkishU.S. Virgin IslanderUgandanUkrainianUruguayanUteVenezuelanVietnameseWelshWest IndianYakamaYaquiYugoslavianYumanYup'ikZimbabwean
Immigration
NonimmigrantsImmigrantsAfghanistanAfricaAlbaniaArgentinaArmeniaAsiaAustraliaAustriaBahamasBangladeshBarbadosBelarusBelgiumBelizeBoliviaBosnia and HerzegovinaBrazilBulgariaBurma/MyanmarCabo VerdeCambodiaCameroonCanadaCaribbeanCentral AmericaChileChinaColombiaCongoCosta RicaCroatiaCubaCzechoslovakiaDenmarkDominicaDominican RepublicEastern AfricaEastern AsiaEastern EuropeEcuadorEgyptEl SalvadorEnglandEritreaEthiopiaEuropeFijiFranceGermanyGhanaGreeceGrenadaGuatemalaGuyanaHaitiHondurasHong KongHungaryIndiaIndonesiaIranIraqIrelandIsraelItalyJamaicaJapanJordanKazakhstanKenyaKoreaKuwaitLaosLatin AmericaLatviaLebanonLiberiaLithuaniaMalaysiaMexicoMicronesiaMiddle AfricaMoldovaMoroccoNepalNetherlandsNicaraguaNigeriaNorth AmericaNorth MacedoniaNorthern AfricaNorthern EuropeNorwayOceaniaPakistanPeruPhilippinesPolandPortugalRomaniaRussiaSaudi ArabiaScotlandSenegalSerbiaSierra LeoneSingaporeSomaliaSouth AfricaSouth AmericaSouth Central AsiaSouth Eastern AsiaSouthern EuropeSpainSri LankaSt. Vincent and the GrenadinesSudanSwedenSwitzerlandSyriaTaiwanThailandTrinidad and TobagoTurkeyUgandaUkraineUruguayUzbekistanVenezuelaVietnamWest IndiesWestern AfricaWestern AsiaWestern EuropeYemenZaireZimbabweAzores
Per Capita Income
Income
Poverty
Unemployment
Labor Participation
Family Structure
Vehicle Availability
Education Level
Disability

Per Capita Income Comparison

Immigrants from Panama

Immigrants from Cuba

Poor
Tragic
$41,853
PER CAPITA INCOME
11.6/ 100
METRIC RATING
211th/ 347
METRIC RANK
$34,910
PER CAPITA INCOME
0.0/ 100
METRIC RATING
326th/ 347
METRIC RANK

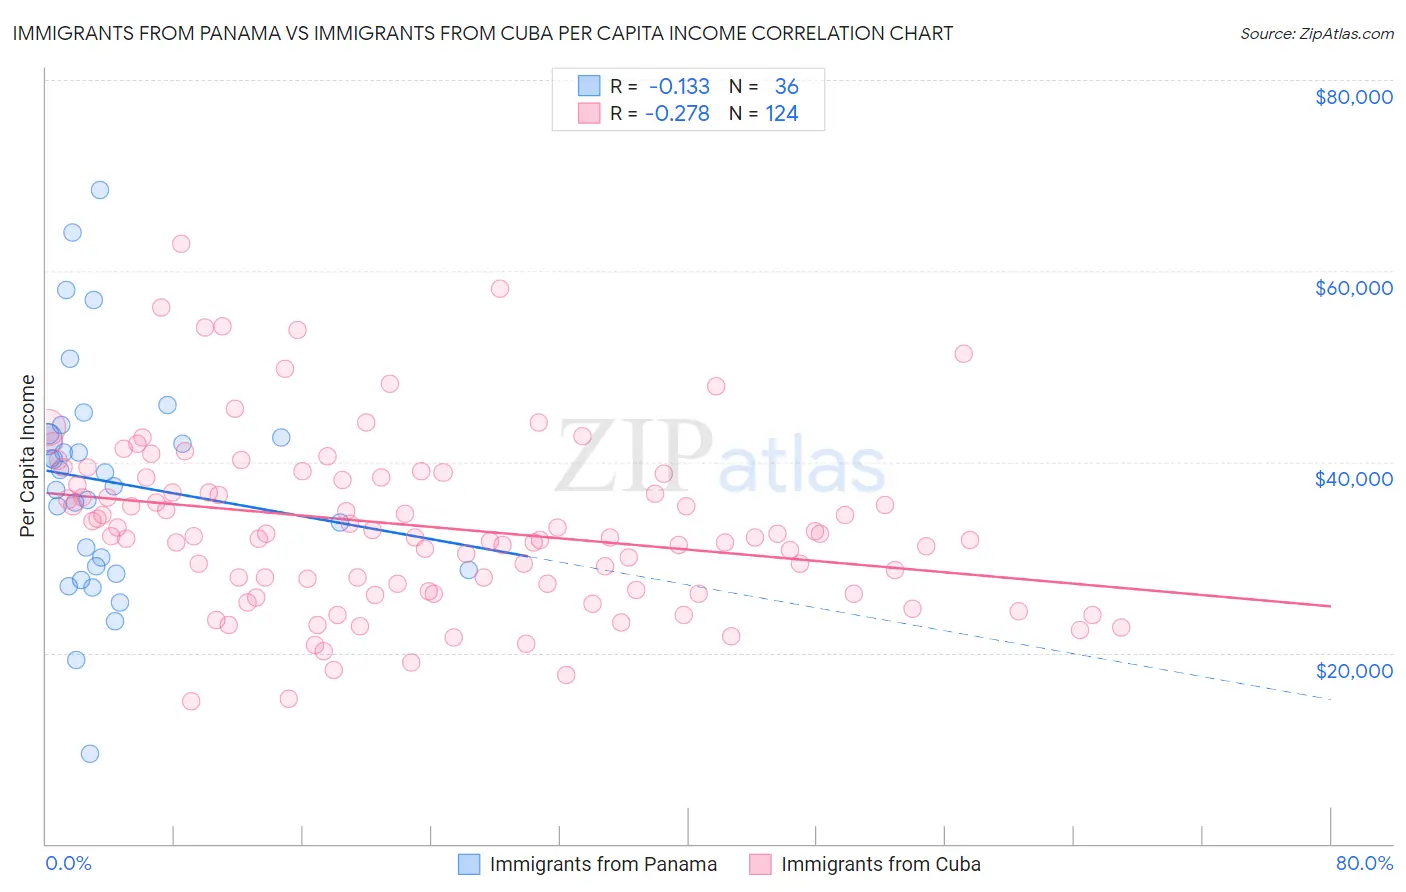
Immigrants from Panama vs Immigrants from Cuba Per Capita Income Correlation Chart

The statistical analysis conducted on geographies consisting of 221,187,071 people shows a poor negative correlation between the proportion of Immigrants from Panama and per capita income in the United States with a correlation coefficient (R) of -0.133 and weighted average of $41,853. Similarly, the statistical analysis conducted on geographies consisting of 325,884,272 people shows a weak negative correlation between the proportion of Immigrants from Cuba and per capita income in the United States with a correlation coefficient (R) of -0.278 and weighted average of $34,910, a difference of 19.9%.
Immigrants from Panama vs Immigrants from Cuba Per Capita Income

Per Capita Income Correlation Summary

MeasurementImmigrants from PanamaImmigrants from Cuba
Minimum$9,397$14,936
Maximum$68,465$62,804
Range$59,068$47,868
Mean$37,915$33,273
Median$38,159$32,226
Interquartile 25% (IQ1)$28,812$26,888
Interquartile 75% (IQ3)$42,786$38,343
Interquartile Range (IQR)$13,974$11,455
Standard Deviation (Sample)$12,078$9,025
Standard Deviation (Population)$11,909$8,989

Similar Demographics by Per Capita Income

Demographics Similar to Immigrants from Panama by Per Capita Income

In terms of per capita income, the demographic groups most similar to Immigrants from Panama are Immigrants from Senegal ($41,830, a difference of 0.050%), Ecuadorian ($41,958, a difference of 0.25%), Immigrants from Venezuela ($41,727, a difference of 0.30%), Immigrants from Sudan ($41,986, a difference of 0.32%), and Immigrants from Bangladesh ($41,709, a difference of 0.34%).
DemographicsRating | RankPer Capita Income
Aleuts
16.4
/100
|
#204
Poor
$42,210
Whites/Caucasians
15.9
/100
|
#205
Poor
$42,180
Ghanaians
15.7
/100
|
#206
Poor
$42,164
Venezuelans
14.4
/100
|
#207
Poor
$42,074
Panamanians
13.9
/100
|
#208
Poor
$42,035
Immigrants | Sudan
13.2
/100
|
#209
Poor
$41,986
Ecuadorians
12.9
/100
|
#210
Poor
$41,958
Immigrants | Panama
11.6
/100
|
#211
Poor
$41,853
Immigrants | Senegal
11.3
/100
|
#212
Poor
$41,830
Immigrants | Venezuela
10.2
/100
|
#213
Poor
$41,727
Immigrants | Bangladesh
10.1
/100
|
#214
Poor
$41,709
Sudanese
9.9
/100
|
#215
Tragic
$41,695
Tongans
9.9
/100
|
#216
Tragic
$41,693
Guamanians/Chamorros
9.7
/100
|
#217
Tragic
$41,678
Trinidadians and Tobagonians
9.5
/100
|
#218
Tragic
$41,655

Demographics Similar to Immigrants from Cuba by Per Capita Income

In terms of per capita income, the demographic groups most similar to Immigrants from Cuba are Apache ($34,886, a difference of 0.070%), Immigrants from Central America ($34,974, a difference of 0.18%), Kiowa ($35,102, a difference of 0.55%), Menominee ($34,578, a difference of 0.96%), and Mexican ($34,559, a difference of 1.0%).
DemographicsRating | RankPer Capita Income
Immigrants | Congo
0.0
/100
|
#319
Tragic
$35,720
Hispanics or Latinos
0.0
/100
|
#320
Tragic
$35,688
Blacks/African Americans
0.0
/100
|
#321
Tragic
$35,564
Creek
0.0
/100
|
#322
Tragic
$35,546
Cheyenne
0.0
/100
|
#323
Tragic
$35,276
Kiowa
0.0
/100
|
#324
Tragic
$35,102
Immigrants | Central America
0.0
/100
|
#325
Tragic
$34,974
Immigrants | Cuba
0.0
/100
|
#326
Tragic
$34,910
Apache
0.0
/100
|
#327
Tragic
$34,886
Menominee
0.0
/100
|
#328
Tragic
$34,578
Mexicans
0.0
/100
|
#329
Tragic
$34,559
Spanish American Indians
0.0
/100
|
#330
Tragic
$34,195
Immigrants | Mexico
0.0
/100
|
#331
Tragic
$33,931
Sioux
0.0
/100
|
#332
Tragic
$33,921
Immigrants | Yemen
0.0
/100
|
#333
Tragic
$33,696