Immigrants from Pakistan vs Immigrants from South Central Asia Householder Income Ages 45 - 64 years
COMPARE
Immigrants from Pakistan
Immigrants from South Central Asia
Householder Income Ages 45 - 64 years
Householder Income Ages 45 - 64 years Comparison
Immigrants from Pakistan
Immigrants from South Central Asia
$114,434
HOUSEHOLDER INCOME AGES 45 - 64 YEARS
99.9/ 100
METRIC RATING
38th/ 347
METRIC RANK
$124,188
HOUSEHOLDER INCOME AGES 45 - 64 YEARS
100.0/ 100
METRIC RATING
10th/ 347
METRIC RANK
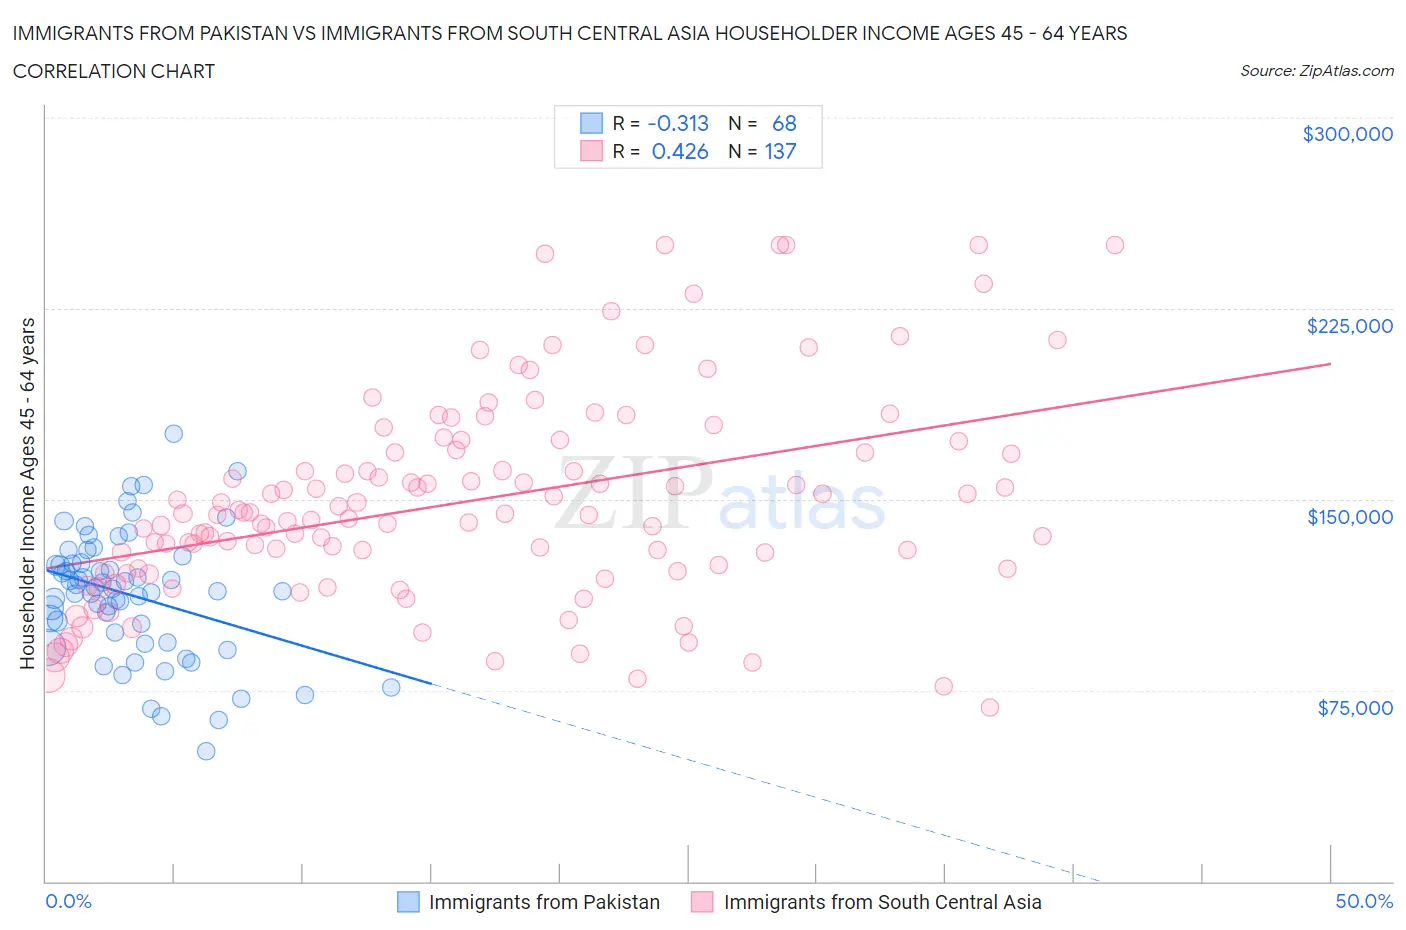
Immigrants from Pakistan vs Immigrants from South Central Asia Householder Income Ages 45 - 64 years Correlation Chart
The statistical analysis conducted on geographies consisting of 283,615,501 people shows a mild negative correlation between the proportion of Immigrants from Pakistan and household income with householder between the ages 45 and 64 in the United States with a correlation coefficient (R) of -0.313 and weighted average of $114,434. Similarly, the statistical analysis conducted on geographies consisting of 471,929,407 people shows a moderate positive correlation between the proportion of Immigrants from South Central Asia and household income with householder between the ages 45 and 64 in the United States with a correlation coefficient (R) of 0.426 and weighted average of $124,188, a difference of 8.5%.
Householder Income Ages 45 - 64 years Correlation Summary
| Measurement | Immigrants from Pakistan | Immigrants from South Central Asia |
| Minimum | $51,094 | $68,125 |
| Maximum | $175,934 | $250,001 |
| Range | $124,840 | $181,876 |
| Mean | $112,409 | $148,894 |
| Median | $114,510 | $144,037 |
| Interquartile 25% (IQ1) | $95,569 | $122,225 |
| Interquartile 75% (IQ3) | $124,922 | $168,955 |
| Interquartile Range (IQR) | $29,353 | $46,731 |
| Standard Deviation (Sample) | $24,730 | $40,252 |
| Standard Deviation (Population) | $24,548 | $40,105 |
Similar Demographics by Householder Income Ages 45 - 64 years
Demographics Similar to Immigrants from Pakistan by Householder Income Ages 45 - 64 years
In terms of householder income ages 45 - 64 years, the demographic groups most similar to Immigrants from Pakistan are Immigrants from Turkey ($114,407, a difference of 0.020%), Cambodian ($114,342, a difference of 0.080%), Immigrants from Lithuania ($114,336, a difference of 0.090%), Estonian ($114,220, a difference of 0.19%), and Israeli ($114,186, a difference of 0.22%).
| Demographics | Rating | Rank | Householder Income Ages 45 - 64 years |
| Immigrants | Asia | 100.0 /100 | #31 | Exceptional $116,566 |
| Russians | 100.0 /100 | #32 | Exceptional $116,328 |
| Chinese | 100.0 /100 | #33 | Exceptional $116,156 |
| Immigrants | Denmark | 100.0 /100 | #34 | Exceptional $116,000 |
| Latvians | 100.0 /100 | #35 | Exceptional $115,957 |
| Immigrants | Switzerland | 100.0 /100 | #36 | Exceptional $115,934 |
| Maltese | 99.9 /100 | #37 | Exceptional $114,754 |
| Immigrants | Pakistan | 99.9 /100 | #38 | Exceptional $114,434 |
| Immigrants | Turkey | 99.9 /100 | #39 | Exceptional $114,407 |
| Cambodians | 99.9 /100 | #40 | Exceptional $114,342 |
| Immigrants | Lithuania | 99.9 /100 | #41 | Exceptional $114,336 |
| Estonians | 99.9 /100 | #42 | Exceptional $114,220 |
| Israelis | 99.9 /100 | #43 | Exceptional $114,186 |
| Bulgarians | 99.9 /100 | #44 | Exceptional $113,883 |
| Immigrants | France | 99.9 /100 | #45 | Exceptional $113,680 |
Demographics Similar to Immigrants from South Central Asia by Householder Income Ages 45 - 64 years
In terms of householder income ages 45 - 64 years, the demographic groups most similar to Immigrants from South Central Asia are Okinawan ($124,796, a difference of 0.49%), Cypriot ($123,396, a difference of 0.64%), Immigrants from Israel ($122,893, a difference of 1.1%), Immigrants from Ireland ($122,757, a difference of 1.2%), and Indian (Asian) ($122,343, a difference of 1.5%).
| Demographics | Rating | Rank | Householder Income Ages 45 - 64 years |
| Immigrants | India | 100.0 /100 | #3 | Exceptional $132,488 |
| Thais | 100.0 /100 | #4 | Exceptional $129,560 |
| Immigrants | Singapore | 100.0 /100 | #5 | Exceptional $129,514 |
| Iranians | 100.0 /100 | #6 | Exceptional $129,350 |
| Immigrants | Hong Kong | 100.0 /100 | #7 | Exceptional $127,500 |
| Immigrants | Iran | 100.0 /100 | #8 | Exceptional $126,940 |
| Okinawans | 100.0 /100 | #9 | Exceptional $124,796 |
| Immigrants | South Central Asia | 100.0 /100 | #10 | Exceptional $124,188 |
| Cypriots | 100.0 /100 | #11 | Exceptional $123,396 |
| Immigrants | Israel | 100.0 /100 | #12 | Exceptional $122,893 |
| Immigrants | Ireland | 100.0 /100 | #13 | Exceptional $122,757 |
| Indians (Asian) | 100.0 /100 | #14 | Exceptional $122,343 |
| Immigrants | Eastern Asia | 100.0 /100 | #15 | Exceptional $122,222 |
| Immigrants | China | 100.0 /100 | #16 | Exceptional $122,178 |
| Burmese | 100.0 /100 | #17 | Exceptional $121,444 |