Immigrants from Oceania vs Immigrants from Italy Median Earnings

COMPARE

Immigrants from Oceania
Race
Ancestry
AfghanAfricanAlaska NativeAlaskan AthabascanAlbanianAleutAlsatianAmericanApacheArabArapahoArgentineanArmenianAssyrian/Chaldean/SyriacAustralianAustrianBahamianBangladeshiBarbadianBasqueBelgianBelizeanBermudanBhutaneseBlackfeetBolivianBrazilianBritishBritish West IndianBulgarianBurmeseCajunCambodianCanadianCape VerdeanCarpatho RusynCelticCentral AmericanCentral American IndianCherokeeCheyenneChickasawChileanChineseChippewaChoctawColombianColvilleComancheCosta RicanCreeCreekCroatianCrowCubanCypriotCzechCzechoslovakianDanishDelawareDominicanDutchDutch West IndianEastern EuropeanEcuadorianEgyptianEnglishEstonianEthiopianEuropeanFijianFilipinoFinnishFrenchFrench American IndianFrench CanadianGermanGerman RussianGhanaianGreekGuamanian/ChamorroGuatemalanGuyaneseHaitianHmongHonduranHopiHoumaHungarianIcelanderIndian (Asian)IndonesianInupiatIranianIraqiIrishIroquoisIsraeliItalianJamaicanJapaneseJordanianKenyanKiowaKoreanLaotianLatvianLebaneseLiberianLithuanianLumbeeLuxembourgerMacedonianMalaysianMalteseMarshalleseMenomineeMexicanMexican American IndianMongolianMoroccanNative HawaiianNavajoNepaleseNew ZealanderNicaraguanNigerianNorthern EuropeanNorwegianOkinawanOsageOttawaPaiutePakistaniPalestinianPanamanianParaguayanPennsylvania GermanPeruvianPimaPolishPortuguesePotawatomiPuebloPuerto RicanPuget Sound SalishRomanianRussianSalvadoranSamoanScandinavianScotch-IrishScottishSeminoleSenegaleseSerbianShoshoneSierra LeoneanSiouxSlavicSlovakSloveneSomaliSouth AfricanSouth AmericanSouth American IndianSoviet UnionSpaniardSpanishSpanish AmericanSpanish American IndianSri LankanSubsaharan AfricanSudaneseSwedishSwissSyrianTaiwaneseThaiTlingit-HaidaTohono O'OdhamTonganTrinidadian and TobagonianTsimshianTurkishU.S. Virgin IslanderUgandanUkrainianUruguayanUteVenezuelanVietnameseWelshWest IndianYakamaYaquiYugoslavianYumanYup'ikZimbabwean
Immigration
NonimmigrantsImmigrantsAfghanistanAfricaAlbaniaArgentinaArmeniaAsiaAustraliaAustriaBahamasBangladeshBarbadosBelarusBelgiumBelizeBoliviaBosnia and HerzegovinaBrazilBulgariaBurma/MyanmarCabo VerdeCambodiaCameroonCanadaCaribbeanCentral AmericaChileChinaColombiaCongoCosta RicaCroatiaCubaCzechoslovakiaDenmarkDominicaDominican RepublicEastern AfricaEastern AsiaEastern EuropeEcuadorEgyptEl SalvadorEnglandEritreaEthiopiaEuropeFijiFranceGermanyGhanaGreeceGrenadaGuatemalaGuyanaHaitiHondurasHong KongHungaryIndiaIndonesiaIranIraqIrelandIsraelJamaicaJapanJordanKazakhstanKenyaKoreaKuwaitLaosLatin AmericaLatviaLebanonLiberiaLithuaniaMalaysiaMexicoMicronesiaMiddle AfricaMoldovaMoroccoNepalNetherlandsNicaraguaNigeriaNorth AmericaNorth MacedoniaNorthern AfricaNorthern EuropeNorwayOceaniaPakistanPanamaPeruPhilippinesPolandPortugalRomaniaRussiaSaudi ArabiaScotlandSenegalSerbiaSierra LeoneSingaporeSomaliaSouth AfricaSouth AmericaSouth Central AsiaSouth Eastern AsiaSouthern EuropeSpainSri LankaSt. Vincent and the GrenadinesSudanSwedenSwitzerlandSyriaTaiwanThailandTrinidad and TobagoTurkeyUgandaUkraineUruguayUzbekistanVenezuelaVietnamWest IndiesWestern AfricaWestern AsiaWestern EuropeYemenZaireZimbabweAzores
Immigrants from Italy
Race
Ancestry
AfghanAfricanAlaska NativeAlaskan AthabascanAlbanianAleutAlsatianAmericanApacheArabArapahoArgentineanArmenianAssyrian/Chaldean/SyriacAustralianAustrianBahamianBangladeshiBarbadianBasqueBelgianBelizeanBermudanBhutaneseBlackfeetBolivianBrazilianBritishBritish West IndianBulgarianBurmeseCajunCambodianCanadianCape VerdeanCarpatho RusynCelticCentral AmericanCentral American IndianCherokeeCheyenneChickasawChileanChineseChippewaChoctawColombianColvilleComancheCosta RicanCreeCreekCroatianCrowCubanCypriotCzechCzechoslovakianDanishDelawareDominicanDutchDutch West IndianEastern EuropeanEcuadorianEgyptianEnglishEstonianEthiopianEuropeanFijianFilipinoFinnishFrenchFrench American IndianFrench CanadianGermanGerman RussianGhanaianGreekGuamanian/ChamorroGuatemalanGuyaneseHaitianHmongHonduranHopiHoumaHungarianIcelanderIndian (Asian)IndonesianInupiatIranianIraqiIrishIroquoisIsraeliItalianJamaicanJapaneseJordanianKenyanKiowaKoreanLaotianLatvianLebaneseLiberianLithuanianLumbeeLuxembourgerMacedonianMalaysianMalteseMarshalleseMenomineeMexicanMexican American IndianMongolianMoroccanNative HawaiianNavajoNepaleseNew ZealanderNicaraguanNigerianNorthern EuropeanNorwegianOkinawanOsageOttawaPaiutePakistaniPalestinianPanamanianParaguayanPennsylvania GermanPeruvianPimaPolishPortuguesePotawatomiPuebloPuerto RicanPuget Sound SalishRomanianRussianSalvadoranSamoanScandinavianScotch-IrishScottishSeminoleSenegaleseSerbianShoshoneSierra LeoneanSiouxSlavicSlovakSloveneSomaliSouth AfricanSouth AmericanSouth American IndianSoviet UnionSpaniardSpanishSpanish AmericanSpanish American IndianSri LankanSubsaharan AfricanSudaneseSwedishSwissSyrianTaiwaneseThaiTlingit-HaidaTohono O'OdhamTonganTrinidadian and TobagonianTsimshianTurkishU.S. Virgin IslanderUgandanUkrainianUruguayanUteVenezuelanVietnameseWelshWest IndianYakamaYaquiYugoslavianYumanYup'ikZimbabwean
Immigration
NonimmigrantsImmigrantsAfghanistanAfricaAlbaniaArgentinaArmeniaAsiaAustraliaAustriaBahamasBangladeshBarbadosBelarusBelgiumBelizeBoliviaBosnia and HerzegovinaBrazilBulgariaBurma/MyanmarCabo VerdeCambodiaCameroonCanadaCaribbeanCentral AmericaChileChinaColombiaCongoCosta RicaCroatiaCubaCzechoslovakiaDenmarkDominicaDominican RepublicEastern AfricaEastern AsiaEastern EuropeEcuadorEgyptEl SalvadorEnglandEritreaEthiopiaEuropeFijiFranceGermanyGhanaGreeceGrenadaGuatemalaGuyanaHaitiHondurasHong KongHungaryIndiaIndonesiaIranIraqIrelandIsraelItalyJamaicaJapanJordanKazakhstanKenyaKoreaKuwaitLaosLatin AmericaLatviaLebanonLiberiaLithuaniaMalaysiaMexicoMicronesiaMiddle AfricaMoldovaMoroccoNepalNetherlandsNicaraguaNigeriaNorth AmericaNorth MacedoniaNorthern AfricaNorthern EuropeNorwayPakistanPanamaPeruPhilippinesPolandPortugalRomaniaRussiaSaudi ArabiaScotlandSenegalSerbiaSierra LeoneSingaporeSomaliaSouth AfricaSouth AmericaSouth Central AsiaSouth Eastern AsiaSouthern EuropeSpainSri LankaSt. Vincent and the GrenadinesSudanSwedenSwitzerlandSyriaTaiwanThailandTrinidad and TobagoTurkeyUgandaUkraineUruguayUzbekistanVenezuelaVietnamWest IndiesWestern AfricaWestern AsiaWestern EuropeYemenZaireZimbabweAzores
Median Earnings
Income
Poverty
Unemployment
Labor Participation
Family Structure
Vehicle Availability
Education Level
Disability

Median Earnings Comparison

Immigrants from Oceania

Immigrants from Italy

Excellent
Exceptional
$47,617
MEDIAN EARNINGS
84.1/ 100
METRIC RATING
151st/ 347
METRIC RANK
$50,581
MEDIAN EARNINGS
99.7/ 100
METRIC RATING
76th/ 347
METRIC RANK

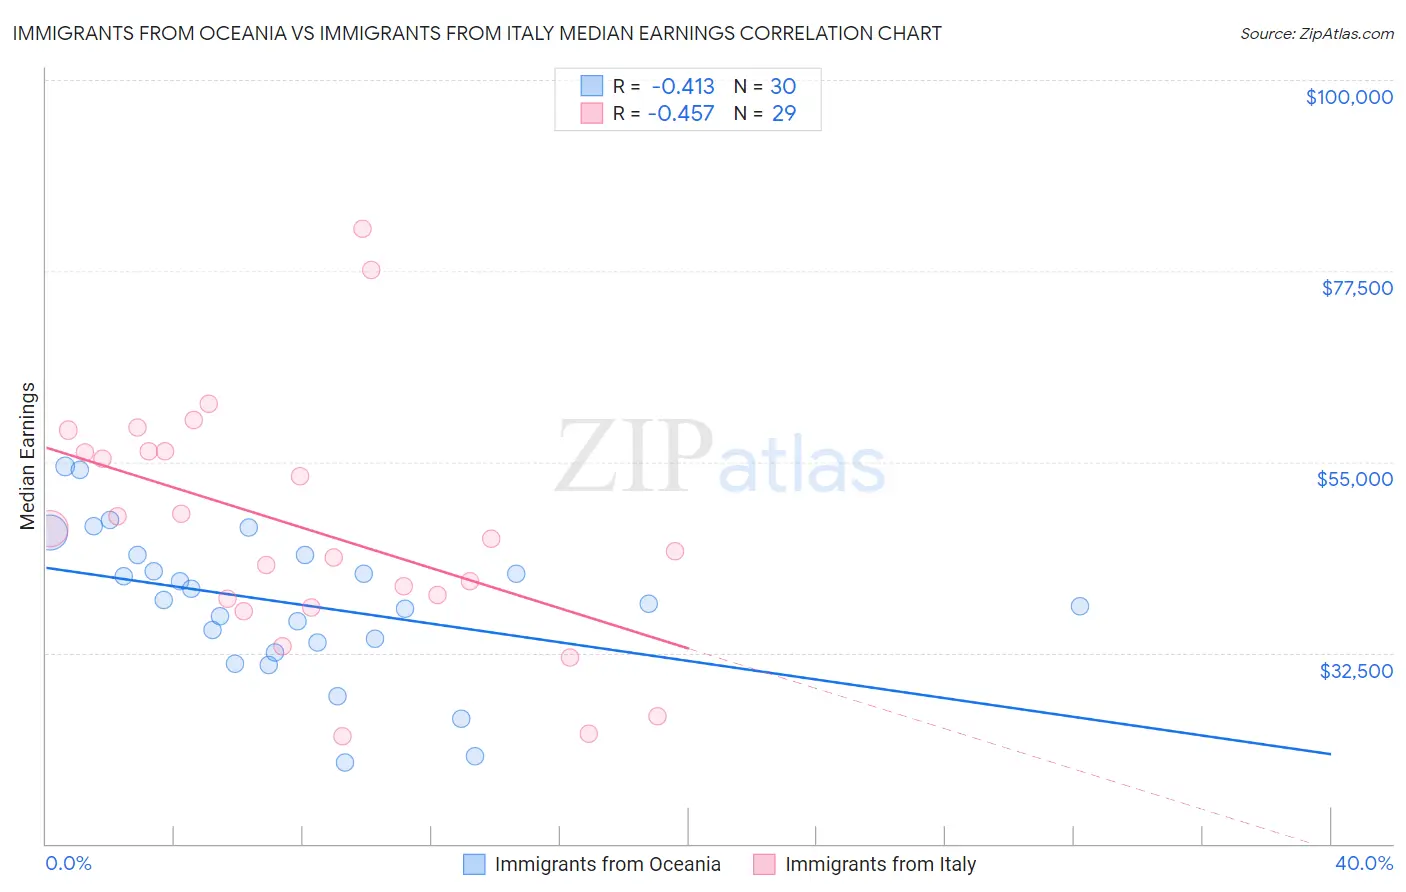
Immigrants from Oceania vs Immigrants from Italy Median Earnings Correlation Chart

The statistical analysis conducted on geographies consisting of 305,514,828 people shows a moderate negative correlation between the proportion of Immigrants from Oceania and median earnings in the United States with a correlation coefficient (R) of -0.413 and weighted average of $47,617. Similarly, the statistical analysis conducted on geographies consisting of 324,208,754 people shows a moderate negative correlation between the proportion of Immigrants from Italy and median earnings in the United States with a correlation coefficient (R) of -0.457 and weighted average of $50,581, a difference of 6.2%.
Immigrants from Oceania vs Immigrants from Italy Median Earnings

Median Earnings Correlation Summary

MeasurementImmigrants from OceaniaImmigrants from Italy
Minimum$19,583$22,656
Maximum$54,486$82,450
Range$34,903$59,794
Mean$38,323$47,205
Median$38,462$46,000
Interquartile 25% (IQ1)$33,709$38,371
Interquartile 75% (IQ3)$44,026$56,217
Interquartile Range (IQR)$10,317$17,846
Standard Deviation (Sample)$8,581$14,283
Standard Deviation (Population)$8,437$14,035

Similar Demographics by Median Earnings

Demographics Similar to Immigrants from Oceania by Median Earnings

In terms of median earnings, the demographic groups most similar to Immigrants from Oceania are Peruvian ($47,628, a difference of 0.020%), Luxembourger ($47,640, a difference of 0.050%), Immigrants from Eritrea ($47,657, a difference of 0.080%), Immigrants from South Eastern Asia ($47,671, a difference of 0.11%), and Immigrants from Germany ($47,566, a difference of 0.11%).
DemographicsRating | RankMedian Earnings
Hungarians
87.1
/100
|
#144
Excellent
$47,795
Immigrants | Saudi Arabia
85.6
/100
|
#145
Excellent
$47,704
Immigrants | Chile
85.5
/100
|
#146
Excellent
$47,697
Immigrants | South Eastern Asia
85.0
/100
|
#147
Excellent
$47,671
Immigrants | Eritrea
84.8
/100
|
#148
Excellent
$47,657
Luxembourgers
84.5
/100
|
#149
Excellent
$47,640
Peruvians
84.2
/100
|
#150
Excellent
$47,628
Immigrants | Oceania
84.1
/100
|
#151
Excellent
$47,617
Immigrants | Germany
83.1
/100
|
#152
Excellent
$47,566
Slavs
81.1
/100
|
#153
Excellent
$47,470
Immigrants | Portugal
77.3
/100
|
#154
Good
$47,304
Immigrants | Vietnam
76.7
/100
|
#155
Good
$47,282
Irish
76.6
/100
|
#156
Good
$47,276
Czechs
75.1
/100
|
#157
Good
$47,221
Slovaks
71.7
/100
|
#158
Good
$47,095

Demographics Similar to Immigrants from Italy by Median Earnings

In terms of median earnings, the demographic groups most similar to Immigrants from Italy are Immigrants from Western Europe ($50,549, a difference of 0.060%), Immigrants from Scotland ($50,741, a difference of 0.32%), South African ($50,752, a difference of 0.34%), Argentinean ($50,399, a difference of 0.36%), and Immigrants from Netherlands ($50,818, a difference of 0.47%).
DemographicsRating | RankMedian Earnings
Mongolians
99.8
/100
|
#69
Exceptional
$51,038
Lithuanians
99.8
/100
|
#70
Exceptional
$50,991
Immigrants | Ukraine
99.8
/100
|
#71
Exceptional
$50,984
Immigrants | Egypt
99.8
/100
|
#72
Exceptional
$50,901
Immigrants | Netherlands
99.8
/100
|
#73
Exceptional
$50,818
South Africans
99.8
/100
|
#74
Exceptional
$50,752
Immigrants | Scotland
99.8
/100
|
#75
Exceptional
$50,741
Immigrants | Italy
99.7
/100
|
#76
Exceptional
$50,581
Immigrants | Western Europe
99.7
/100
|
#77
Exceptional
$50,549
Argentineans
99.6
/100
|
#78
Exceptional
$50,399
Laotians
99.6
/100
|
#79
Exceptional
$50,343
Ukrainians
99.6
/100
|
#80
Exceptional
$50,320
Immigrants | Southern Europe
99.6
/100
|
#81
Exceptional
$50,280
Immigrants | Moldova
99.5
/100
|
#82
Exceptional
$50,274
Romanians
99.5
/100
|
#83
Exceptional
$50,244