Immigrants from Oceania vs Finnish Median Male Earnings
COMPARE
Immigrants from Oceania
Finnish
Median Male Earnings
Median Male Earnings Comparison
Immigrants from Oceania
Finns
$55,712
MEDIAN MALE EARNINGS
76.8/ 100
METRIC RATING
151st/ 347
METRIC RANK
$54,721
MEDIAN MALE EARNINGS
55.6/ 100
METRIC RATING
170th/ 347
METRIC RANK
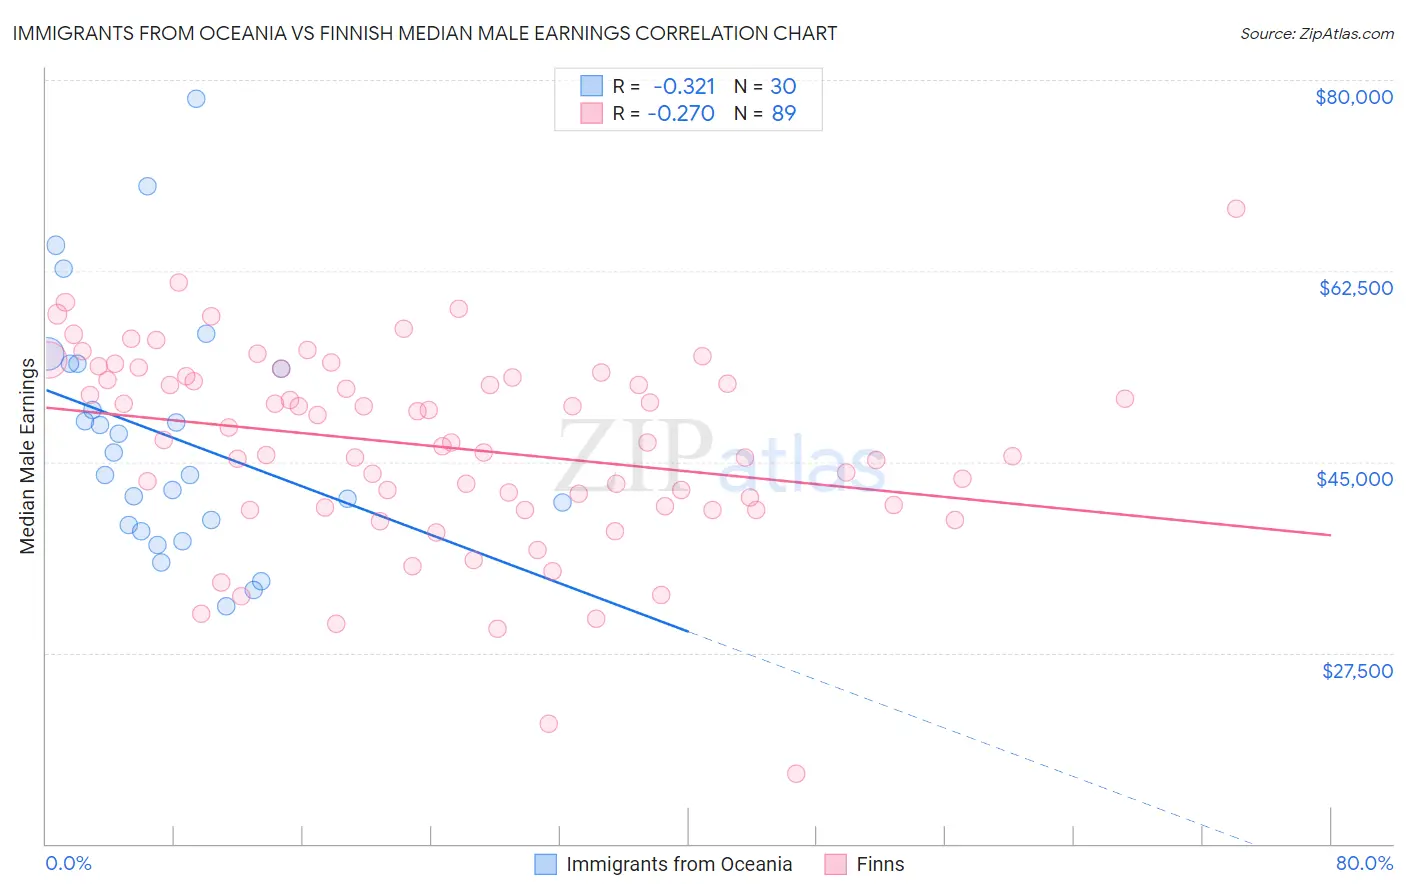
Immigrants from Oceania vs Finnish Median Male Earnings Correlation Chart
The statistical analysis conducted on geographies consisting of 305,444,648 people shows a mild negative correlation between the proportion of Immigrants from Oceania and median male earnings in the United States with a correlation coefficient (R) of -0.321 and weighted average of $55,712. Similarly, the statistical analysis conducted on geographies consisting of 404,473,332 people shows a weak negative correlation between the proportion of Finns and median male earnings in the United States with a correlation coefficient (R) of -0.270 and weighted average of $54,721, a difference of 1.8%.
Median Male Earnings Correlation Summary
| Measurement | Immigrants from Oceania | Finnish |
| Minimum | $31,736 | $16,413 |
| Maximum | $78,276 | $68,250 |
| Range | $46,540 | $51,837 |
| Mean | $47,354 | $46,398 |
| Median | $44,818 | $46,792 |
| Interquartile 25% (IQ1) | $39,222 | $40,892 |
| Interquartile 75% (IQ3) | $54,011 | $52,786 |
| Interquartile Range (IQR) | $14,789 | $11,894 |
| Standard Deviation (Sample) | $11,148 | $8,951 |
| Standard Deviation (Population) | $10,961 | $8,900 |
Demographics Similar to Immigrants from Oceania and Finns by Median Male Earnings
In terms of median male earnings, the demographic groups most similar to Immigrants from Oceania are Swiss ($55,731, a difference of 0.030%), Peruvian ($55,659, a difference of 0.10%), Immigrants from Nepal ($55,615, a difference of 0.17%), Taiwanese ($55,556, a difference of 0.28%), and Scandinavian ($55,527, a difference of 0.33%). Similarly, the demographic groups most similar to Finns are French Canadian ($54,722, a difference of 0.0%), Immigrants from Vietnam ($54,913, a difference of 0.35%), Immigrants from Fiji ($54,958, a difference of 0.43%), German ($54,974, a difference of 0.46%), and Immigrants from Portugal ($55,182, a difference of 0.84%).
| Demographics | Rating | Rank | Median Male Earnings |
| Swiss | 77.1 /100 | #150 | Good $55,731 |
| Immigrants | Oceania | 76.8 /100 | #151 | Good $55,712 |
| Peruvians | 75.8 /100 | #152 | Good $55,659 |
| Immigrants | Nepal | 75.0 /100 | #153 | Good $55,615 |
| Taiwanese | 73.9 /100 | #154 | Good $55,556 |
| Scandinavians | 73.4 /100 | #155 | Good $55,527 |
| Immigrants | Ethiopia | 71.6 /100 | #156 | Good $55,434 |
| Icelanders | 71.2 /100 | #157 | Good $55,415 |
| Czechoslovakians | 70.5 /100 | #158 | Good $55,382 |
| Alsatians | 70.5 /100 | #159 | Good $55,380 |
| Basques | 70.3 /100 | #160 | Good $55,370 |
| Belgians | 70.1 /100 | #161 | Good $55,361 |
| French | 69.9 /100 | #162 | Good $55,350 |
| Ugandans | 68.6 /100 | #163 | Good $55,290 |
| Immigrants | South Eastern Asia | 67.6 /100 | #164 | Good $55,241 |
| Immigrants | Portugal | 66.3 /100 | #165 | Good $55,182 |
| Germans | 61.6 /100 | #166 | Good $54,974 |
| Immigrants | Fiji | 61.2 /100 | #167 | Good $54,958 |
| Immigrants | Vietnam | 60.2 /100 | #168 | Good $54,913 |
| French Canadians | 55.6 /100 | #169 | Average $54,722 |
| Finns | 55.6 /100 | #170 | Average $54,721 |