Immigrants from North Macedonia vs Immigrants from Austria Householder Income Ages 25 - 44 years
COMPARE
Immigrants from North Macedonia
Immigrants from Austria
Householder Income Ages 25 - 44 years
Householder Income Ages 25 - 44 years Comparison
Immigrants from North Macedonia
Immigrants from Austria
$100,101
HOUSEHOLDER INCOME AGES 25 - 44 YEARS
95.6/ 100
METRIC RATING
109th/ 347
METRIC RANK
$106,103
HOUSEHOLDER INCOME AGES 25 - 44 YEARS
99.8/ 100
METRIC RATING
57th/ 347
METRIC RANK
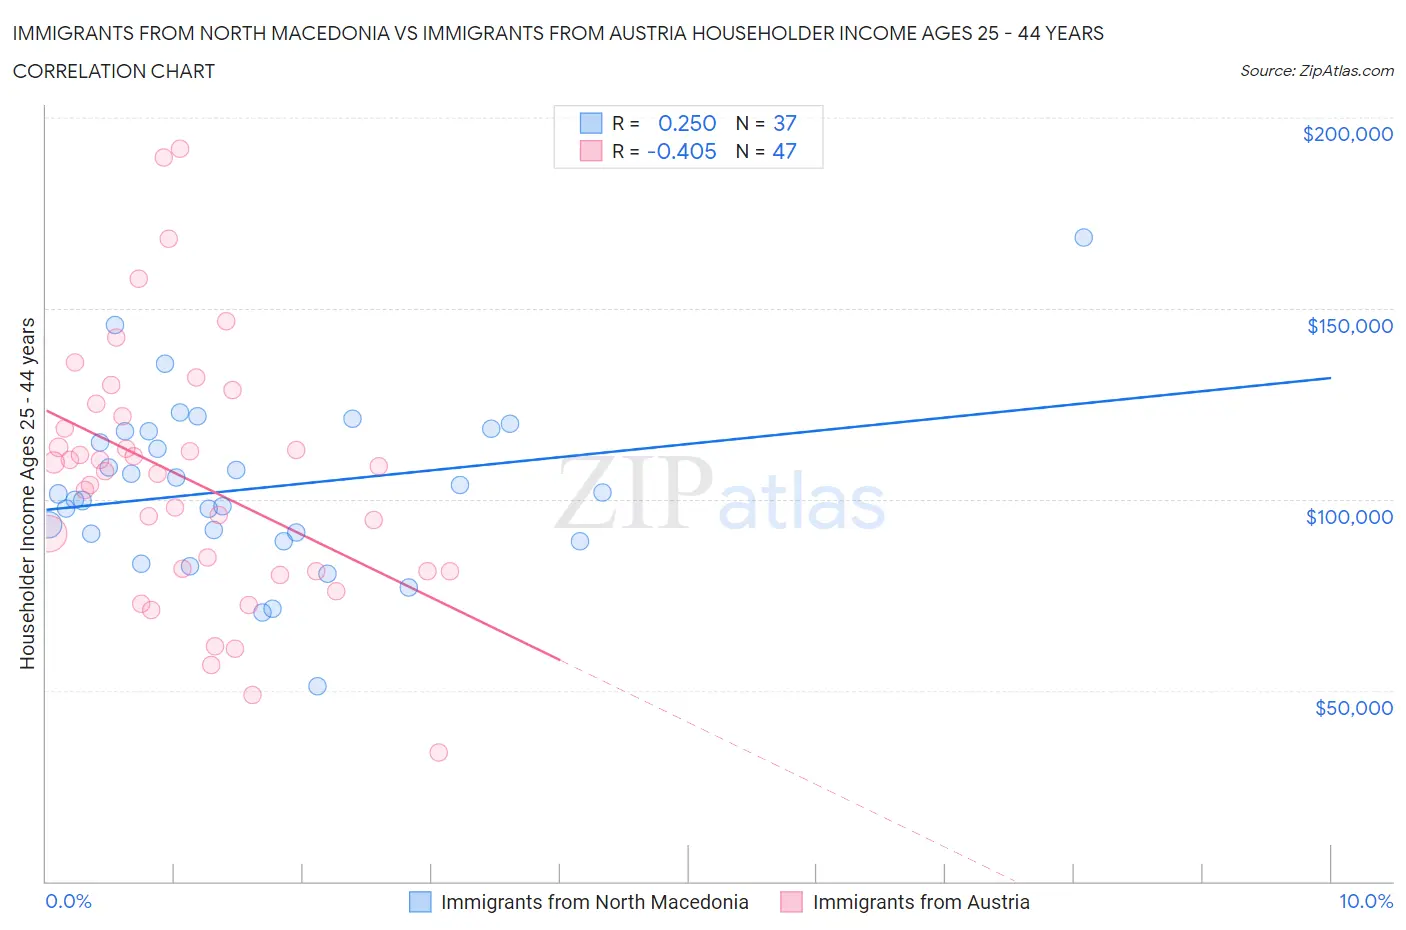
Immigrants from North Macedonia vs Immigrants from Austria Householder Income Ages 25 - 44 years Correlation Chart
The statistical analysis conducted on geographies consisting of 74,266,818 people shows a weak positive correlation between the proportion of Immigrants from North Macedonia and household income with householder between the ages 25 and 44 in the United States with a correlation coefficient (R) of 0.250 and weighted average of $100,101. Similarly, the statistical analysis conducted on geographies consisting of 167,639,704 people shows a moderate negative correlation between the proportion of Immigrants from Austria and household income with householder between the ages 25 and 44 in the United States with a correlation coefficient (R) of -0.405 and weighted average of $106,103, a difference of 6.0%.
Householder Income Ages 25 - 44 years Correlation Summary
| Measurement | Immigrants from North Macedonia | Immigrants from Austria |
| Minimum | $51,151 | $33,571 |
| Maximum | $168,534 | $191,842 |
| Range | $117,383 | $158,271 |
| Mean | $102,890 | $105,149 |
| Median | $101,325 | $107,519 |
| Interquartile 25% (IQ1) | $89,993 | $81,250 |
| Interquartile 75% (IQ3) | $117,844 | $121,802 |
| Interquartile Range (IQR) | $27,851 | $40,552 |
| Standard Deviation (Sample) | $21,872 | $33,347 |
| Standard Deviation (Population) | $21,575 | $32,991 |
Similar Demographics by Householder Income Ages 25 - 44 years
Demographics Similar to Immigrants from North Macedonia by Householder Income Ages 25 - 44 years
In terms of householder income ages 25 - 44 years, the demographic groups most similar to Immigrants from North Macedonia are Immigrants from Afghanistan ($99,977, a difference of 0.12%), Immigrants from South Eastern Asia ($100,283, a difference of 0.18%), Chilean ($99,900, a difference of 0.20%), Northern European ($100,457, a difference of 0.36%), and Polish ($99,685, a difference of 0.42%).
| Demographics | Rating | Rank | Householder Income Ages 25 - 44 years |
| Immigrants | Lebanon | 97.4 /100 | #102 | Exceptional $101,124 |
| Immigrants | Moldova | 97.4 /100 | #103 | Exceptional $101,091 |
| Immigrants | Poland | 97.4 /100 | #104 | Exceptional $101,065 |
| Immigrants | Vietnam | 96.5 /100 | #105 | Exceptional $100,535 |
| Immigrants | Brazil | 96.5 /100 | #106 | Exceptional $100,534 |
| Northern Europeans | 96.3 /100 | #107 | Exceptional $100,457 |
| Immigrants | South Eastern Asia | 96.0 /100 | #108 | Exceptional $100,283 |
| Immigrants | North Macedonia | 95.6 /100 | #109 | Exceptional $100,101 |
| Immigrants | Afghanistan | 95.3 /100 | #110 | Exceptional $99,977 |
| Chileans | 95.1 /100 | #111 | Exceptional $99,900 |
| Poles | 94.5 /100 | #112 | Exceptional $99,685 |
| Tongans | 94.2 /100 | #113 | Exceptional $99,604 |
| Immigrants | Western Asia | 94.0 /100 | #114 | Exceptional $99,516 |
| Carpatho Rusyns | 93.7 /100 | #115 | Exceptional $99,449 |
| Portuguese | 93.7 /100 | #116 | Exceptional $99,429 |
Demographics Similar to Immigrants from Austria by Householder Income Ages 25 - 44 years
In terms of householder income ages 25 - 44 years, the demographic groups most similar to Immigrants from Austria are Immigrants from Pakistan ($106,129, a difference of 0.030%), Greek ($106,457, a difference of 0.33%), Immigrants from South Africa ($105,748, a difference of 0.34%), Paraguayan ($106,615, a difference of 0.48%), and Immigrants from Norway ($106,629, a difference of 0.50%).
| Demographics | Rating | Rank | Householder Income Ages 25 - 44 years |
| Cambodians | 99.9 /100 | #50 | Exceptional $107,148 |
| Immigrants | Czechoslovakia | 99.9 /100 | #51 | Exceptional $106,888 |
| Immigrants | Europe | 99.9 /100 | #52 | Exceptional $106,817 |
| Immigrants | Norway | 99.9 /100 | #53 | Exceptional $106,629 |
| Paraguayans | 99.9 /100 | #54 | Exceptional $106,615 |
| Greeks | 99.9 /100 | #55 | Exceptional $106,457 |
| Immigrants | Pakistan | 99.8 /100 | #56 | Exceptional $106,129 |
| Immigrants | Austria | 99.8 /100 | #57 | Exceptional $106,103 |
| Immigrants | South Africa | 99.8 /100 | #58 | Exceptional $105,748 |
| Immigrants | Latvia | 99.8 /100 | #59 | Exceptional $105,522 |
| Egyptians | 99.7 /100 | #60 | Exceptional $105,282 |
| Lithuanians | 99.7 /100 | #61 | Exceptional $105,223 |
| Immigrants | Italy | 99.7 /100 | #62 | Exceptional $105,201 |
| Immigrants | Scotland | 99.7 /100 | #63 | Exceptional $105,089 |
| New Zealanders | 99.7 /100 | #64 | Exceptional $105,085 |