Immigrants from North America vs Immigrants from South Africa Householder Income Ages 45 - 64 years
COMPARE
Immigrants from North America
Immigrants from South Africa
Householder Income Ages 45 - 64 years
Householder Income Ages 45 - 64 years Comparison
Immigrants from North America
Immigrants from South Africa
$109,198
HOUSEHOLDER INCOME AGES 45 - 64 YEARS
98.8/ 100
METRIC RATING
82nd/ 347
METRIC RANK
$112,886
HOUSEHOLDER INCOME AGES 45 - 64 YEARS
99.8/ 100
METRIC RATING
51st/ 347
METRIC RANK
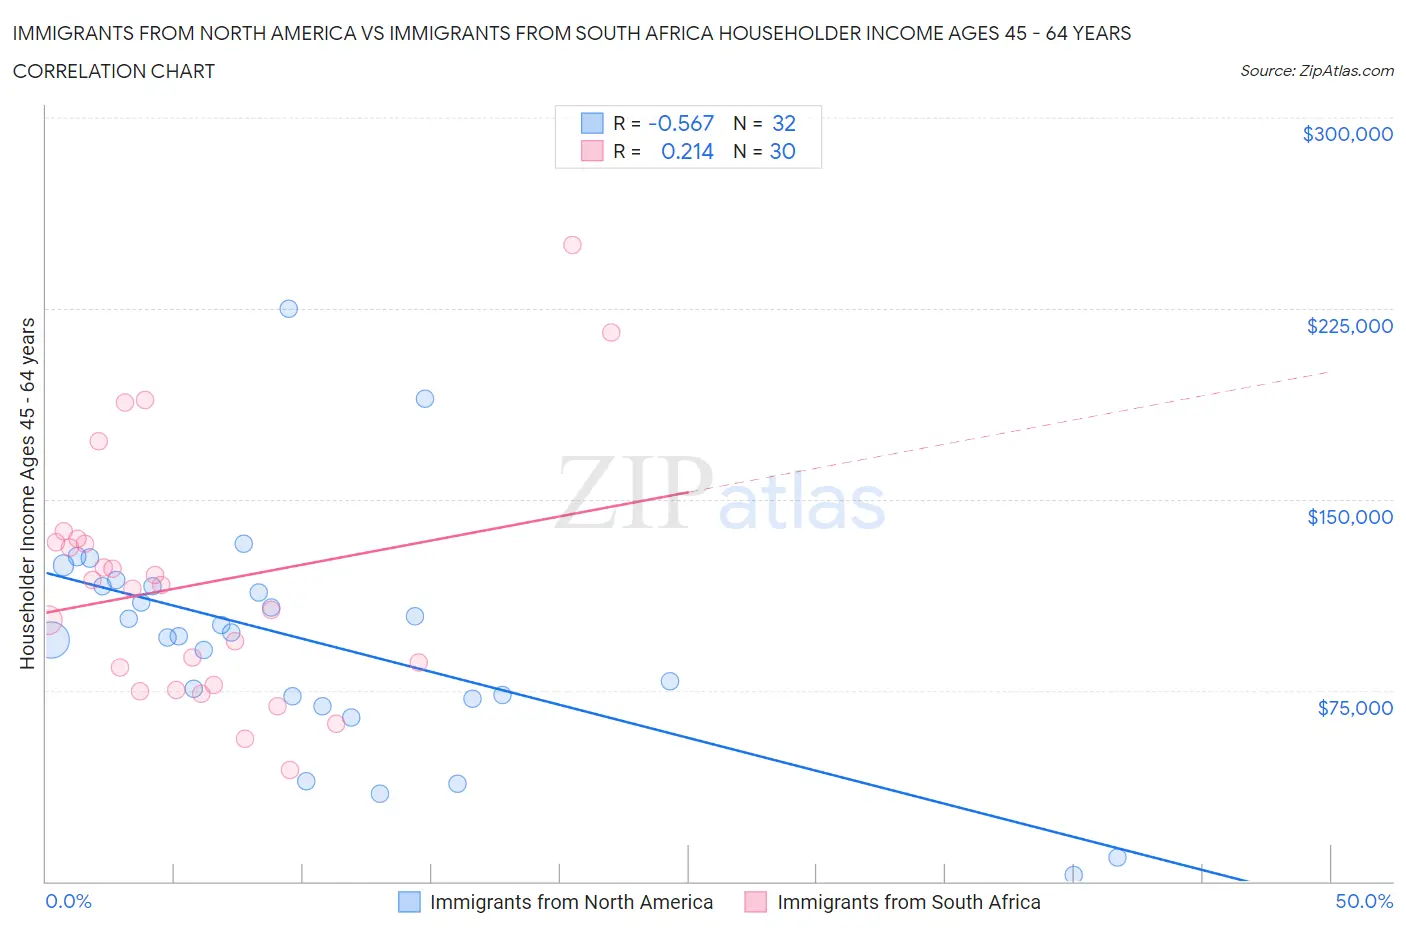
Immigrants from North America vs Immigrants from South Africa Householder Income Ages 45 - 64 years Correlation Chart
The statistical analysis conducted on geographies consisting of 461,409,956 people shows a substantial negative correlation between the proportion of Immigrants from North America and household income with householder between the ages 45 and 64 in the United States with a correlation coefficient (R) of -0.567 and weighted average of $109,198. Similarly, the statistical analysis conducted on geographies consisting of 233,154,360 people shows a weak positive correlation between the proportion of Immigrants from South Africa and household income with householder between the ages 45 and 64 in the United States with a correlation coefficient (R) of 0.214 and weighted average of $112,886, a difference of 3.4%.
Householder Income Ages 45 - 64 years Correlation Summary
| Measurement | Immigrants from North America | Immigrants from South Africa |
| Minimum | $2,499 | $43,750 |
| Maximum | $225,000 | $250,001 |
| Range | $222,501 | $206,251 |
| Mean | $94,322 | $116,416 |
| Median | $96,912 | $115,780 |
| Interquartile 25% (IQ1) | $72,197 | $77,125 |
| Interquartile 75% (IQ3) | $115,910 | $133,043 |
| Interquartile Range (IQR) | $43,714 | $55,918 |
| Standard Deviation (Sample) | $44,789 | $48,210 |
| Standard Deviation (Population) | $44,084 | $47,400 |
Similar Demographics by Householder Income Ages 45 - 64 years
Demographics Similar to Immigrants from North America by Householder Income Ages 45 - 64 years
In terms of householder income ages 45 - 64 years, the demographic groups most similar to Immigrants from North America are Immigrants from Eastern Europe ($109,335, a difference of 0.12%), Immigrants from Spain ($109,051, a difference of 0.14%), Jordanian ($109,376, a difference of 0.16%), Immigrants from Bulgaria ($109,379, a difference of 0.17%), and Immigrants from Canada ($109,402, a difference of 0.19%).
| Demographics | Rating | Rank | Householder Income Ages 45 - 64 years |
| South Africans | 99.1 /100 | #75 | Exceptional $109,719 |
| Paraguayans | 99.0 /100 | #76 | Exceptional $109,447 |
| Immigrants | England | 99.0 /100 | #77 | Exceptional $109,446 |
| Immigrants | Canada | 99.0 /100 | #78 | Exceptional $109,402 |
| Immigrants | Bulgaria | 98.9 /100 | #79 | Exceptional $109,379 |
| Jordanians | 98.9 /100 | #80 | Exceptional $109,376 |
| Immigrants | Eastern Europe | 98.9 /100 | #81 | Exceptional $109,335 |
| Immigrants | North America | 98.8 /100 | #82 | Exceptional $109,198 |
| Immigrants | Spain | 98.8 /100 | #83 | Exceptional $109,051 |
| Immigrants | Western Europe | 98.6 /100 | #84 | Exceptional $108,824 |
| Immigrants | Afghanistan | 98.6 /100 | #85 | Exceptional $108,785 |
| Austrians | 98.5 /100 | #86 | Exceptional $108,692 |
| Tongans | 98.5 /100 | #87 | Exceptional $108,643 |
| Romanians | 98.5 /100 | #88 | Exceptional $108,609 |
| Ukrainians | 98.3 /100 | #89 | Exceptional $108,475 |
Demographics Similar to Immigrants from South Africa by Householder Income Ages 45 - 64 years
In terms of householder income ages 45 - 64 years, the demographic groups most similar to Immigrants from South Africa are Immigrants from Malaysia ($112,796, a difference of 0.080%), Afghan ($112,676, a difference of 0.19%), Immigrants from Austria ($113,140, a difference of 0.22%), Greek ($112,630, a difference of 0.23%), and Immigrants from Russia ($113,215, a difference of 0.29%).
| Demographics | Rating | Rank | Householder Income Ages 45 - 64 years |
| Bulgarians | 99.9 /100 | #44 | Exceptional $113,883 |
| Immigrants | France | 99.9 /100 | #45 | Exceptional $113,680 |
| Immigrants | Greece | 99.9 /100 | #46 | Exceptional $113,548 |
| Australians | 99.9 /100 | #47 | Exceptional $113,533 |
| Immigrants | Indonesia | 99.9 /100 | #48 | Exceptional $113,519 |
| Immigrants | Russia | 99.8 /100 | #49 | Exceptional $113,215 |
| Immigrants | Austria | 99.8 /100 | #50 | Exceptional $113,140 |
| Immigrants | South Africa | 99.8 /100 | #51 | Exceptional $112,886 |
| Immigrants | Malaysia | 99.8 /100 | #52 | Exceptional $112,796 |
| Afghans | 99.8 /100 | #53 | Exceptional $112,676 |
| Greeks | 99.8 /100 | #54 | Exceptional $112,630 |
| Lithuanians | 99.8 /100 | #55 | Exceptional $112,484 |
| Egyptians | 99.7 /100 | #56 | Exceptional $112,256 |
| Immigrants | Scotland | 99.7 /100 | #57 | Exceptional $112,175 |
| Soviet Union | 99.7 /100 | #58 | Exceptional $112,008 |