Immigrants from North America vs Immigrants from Argentina Median Household Income
COMPARE
Immigrants from North America
Immigrants from Argentina
Median Household Income
Median Household Income Comparison
Immigrants from North America
Immigrants from Argentina
$91,860
MEDIAN HOUSEHOLD INCOME
98.7/ 100
METRIC RATING
94th/ 347
METRIC RANK
$92,417
MEDIAN HOUSEHOLD INCOME
99.1/ 100
METRIC RATING
84th/ 347
METRIC RANK
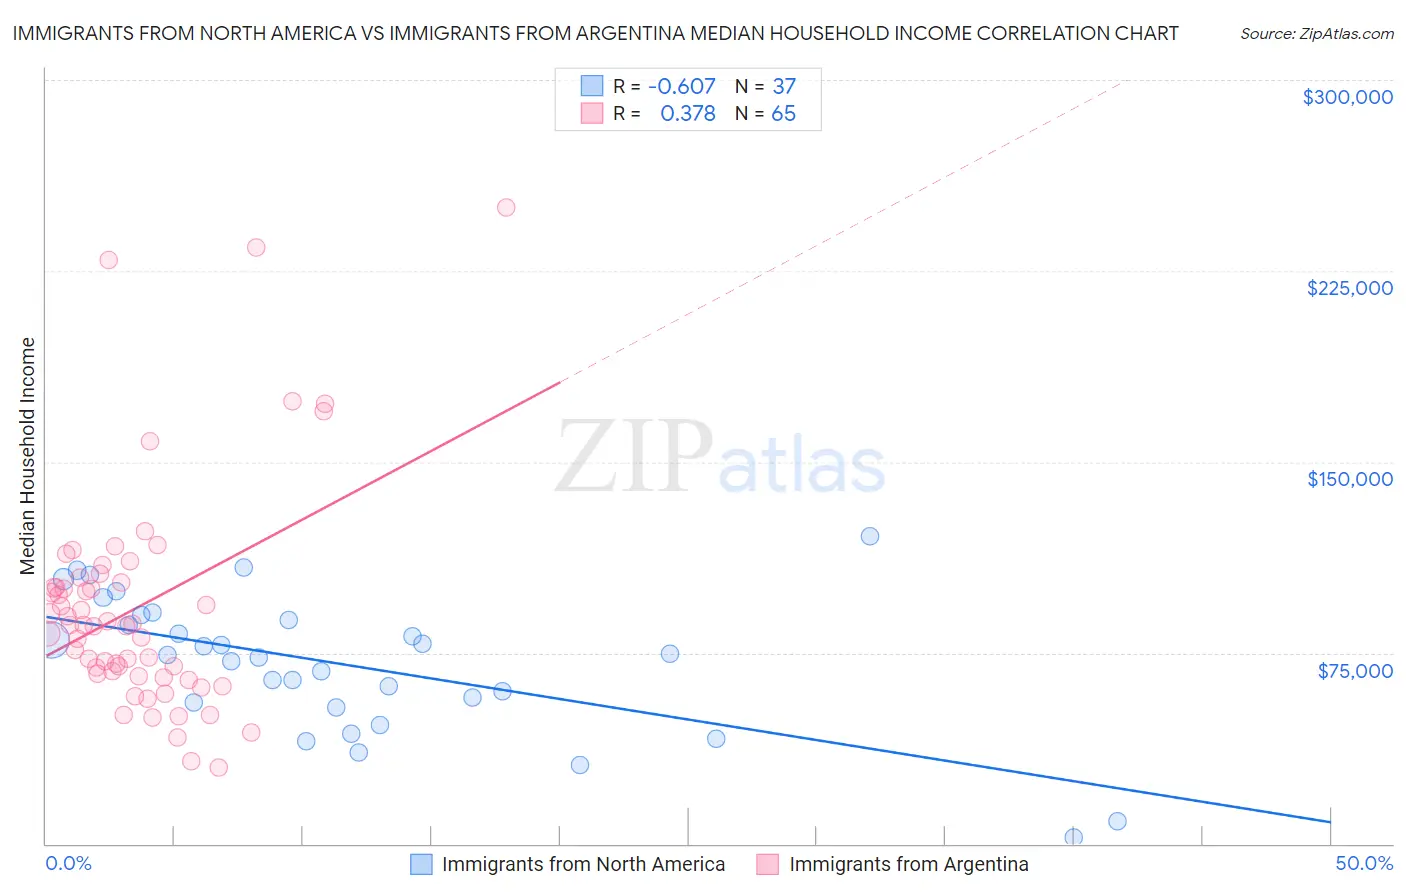
Immigrants from North America vs Immigrants from Argentina Median Household Income Correlation Chart
The statistical analysis conducted on geographies consisting of 462,084,352 people shows a significant negative correlation between the proportion of Immigrants from North America and median household income in the United States with a correlation coefficient (R) of -0.607 and weighted average of $91,860. Similarly, the statistical analysis conducted on geographies consisting of 264,333,035 people shows a mild positive correlation between the proportion of Immigrants from Argentina and median household income in the United States with a correlation coefficient (R) of 0.378 and weighted average of $92,417, a difference of 0.61%.
Median Household Income Correlation Summary
| Measurement | Immigrants from North America | Immigrants from Argentina |
| Minimum | $2,499 | $29,759 |
| Maximum | $120,804 | $250,001 |
| Range | $118,305 | $220,242 |
| Mean | $70,374 | $92,999 |
| Median | $74,312 | $85,824 |
| Interquartile 25% (IQ1) | $54,648 | $66,317 |
| Interquartile 75% (IQ3) | $88,741 | $103,452 |
| Interquartile Range (IQR) | $34,094 | $37,135 |
| Standard Deviation (Sample) | $27,060 | $44,164 |
| Standard Deviation (Population) | $26,692 | $43,823 |
Demographics Similar to Immigrants from North America and Immigrants from Argentina by Median Household Income
In terms of median household income, the demographic groups most similar to Immigrants from North America are Immigrants from Lebanon ($91,887, a difference of 0.030%), Armenian ($91,807, a difference of 0.060%), Jordanian ($91,794, a difference of 0.070%), Immigrants from Western Europe ($91,936, a difference of 0.080%), and Assyrian/Chaldean/Syriac ($91,991, a difference of 0.14%). Similarly, the demographic groups most similar to Immigrants from Argentina are Italian ($92,475, a difference of 0.060%), Immigrants from Croatia ($92,225, a difference of 0.21%), Immigrants from Spain ($92,732, a difference of 0.34%), Immigrants from England ($92,098, a difference of 0.35%), and Immigrants from Hungary ($92,094, a difference of 0.35%).
| Demographics | Rating | Rank | Median Household Income |
| Sri Lankans | 99.4 /100 | #79 | Exceptional $93,093 |
| Tongans | 99.4 /100 | #80 | Exceptional $93,076 |
| Immigrants | Eastern Europe | 99.4 /100 | #81 | Exceptional $93,051 |
| Immigrants | Spain | 99.3 /100 | #82 | Exceptional $92,732 |
| Italians | 99.1 /100 | #83 | Exceptional $92,475 |
| Immigrants | Argentina | 99.1 /100 | #84 | Exceptional $92,417 |
| Immigrants | Croatia | 99.0 /100 | #85 | Exceptional $92,225 |
| Immigrants | England | 98.9 /100 | #86 | Exceptional $92,098 |
| Immigrants | Hungary | 98.9 /100 | #87 | Exceptional $92,094 |
| Immigrants | Canada | 98.8 /100 | #88 | Exceptional $92,029 |
| Romanians | 98.8 /100 | #89 | Exceptional $91,994 |
| Assyrians/Chaldeans/Syriacs | 98.8 /100 | #90 | Exceptional $91,991 |
| Immigrants | Vietnam | 98.8 /100 | #91 | Exceptional $91,987 |
| Immigrants | Western Europe | 98.8 /100 | #92 | Exceptional $91,936 |
| Immigrants | Lebanon | 98.7 /100 | #93 | Exceptional $91,887 |
| Immigrants | North America | 98.7 /100 | #94 | Exceptional $91,860 |
| Armenians | 98.7 /100 | #95 | Exceptional $91,807 |
| Jordanians | 98.7 /100 | #96 | Exceptional $91,794 |
| Immigrants | Serbia | 98.6 /100 | #97 | Exceptional $91,730 |
| Immigrants | Southern Europe | 98.5 /100 | #98 | Exceptional $91,605 |
| Immigrants | South Eastern Asia | 98.4 /100 | #99 | Exceptional $91,541 |