Immigrants from Nicaragua vs Guatemalan Median Family Income
COMPARE
Immigrants from Nicaragua
Guatemalan
Median Family Income
Median Family Income Comparison
Immigrants from Nicaragua
Guatemalans
$88,267
MEDIAN FAMILY INCOME
0.1/ 100
METRIC RATING
286th/ 347
METRIC RANK
$88,295
MEDIAN FAMILY INCOME
0.1/ 100
METRIC RATING
285th/ 347
METRIC RANK
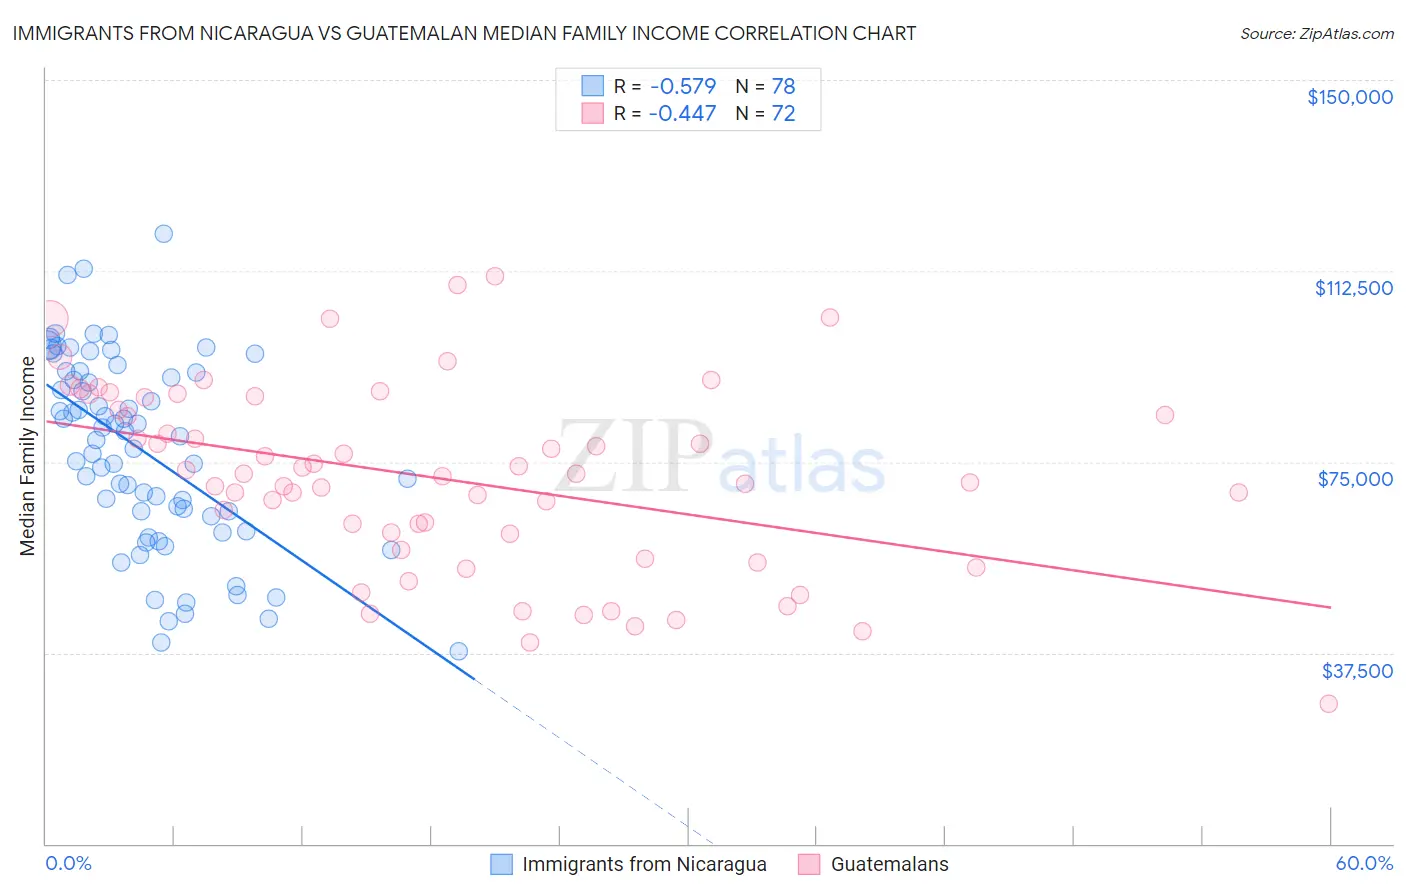
Immigrants from Nicaragua vs Guatemalan Median Family Income Correlation Chart
The statistical analysis conducted on geographies consisting of 236,310,703 people shows a substantial negative correlation between the proportion of Immigrants from Nicaragua and median family income in the United States with a correlation coefficient (R) of -0.579 and weighted average of $88,267. Similarly, the statistical analysis conducted on geographies consisting of 409,160,818 people shows a moderate negative correlation between the proportion of Guatemalans and median family income in the United States with a correlation coefficient (R) of -0.447 and weighted average of $88,295, a difference of 0.030%.
Median Family Income Correlation Summary
| Measurement | Immigrants from Nicaragua | Guatemalan |
| Minimum | $37,806 | $27,406 |
| Maximum | $119,688 | $111,362 |
| Range | $81,882 | $83,956 |
| Mean | $77,073 | $71,713 |
| Median | $79,725 | $72,451 |
| Interquartile 25% (IQ1) | $64,231 | $59,369 |
| Interquartile 75% (IQ3) | $92,500 | $86,431 |
| Interquartile Range (IQR) | $28,269 | $27,062 |
| Standard Deviation (Sample) | $18,710 | $18,247 |
| Standard Deviation (Population) | $18,590 | $18,120 |
Demographics Similar to Immigrants from Nicaragua and Guatemalans by Median Family Income
In terms of median family income, the demographic groups most similar to Immigrants from Nicaragua are Potawatomi ($88,265, a difference of 0.0%), Indonesian ($88,301, a difference of 0.040%), Cherokee ($88,209, a difference of 0.070%), Bangladeshi ($88,358, a difference of 0.10%), and Central American Indian ($88,034, a difference of 0.26%). Similarly, the demographic groups most similar to Guatemalans are Indonesian ($88,301, a difference of 0.010%), Potawatomi ($88,265, a difference of 0.030%), Bangladeshi ($88,358, a difference of 0.070%), Cherokee ($88,209, a difference of 0.10%), and Comanche ($88,556, a difference of 0.29%).
| Demographics | Rating | Rank | Median Family Income |
| Immigrants | St. Vincent and the Grenadines | 0.2 /100 | #275 | Tragic $90,094 |
| Immigrants | Zaire | 0.1 /100 | #276 | Tragic $89,285 |
| Immigrants | Jamaica | 0.1 /100 | #277 | Tragic $89,268 |
| Immigrants | Grenada | 0.1 /100 | #278 | Tragic $89,249 |
| Immigrants | Belize | 0.1 /100 | #279 | Tragic $89,197 |
| British West Indians | 0.1 /100 | #280 | Tragic $88,987 |
| Blackfeet | 0.1 /100 | #281 | Tragic $88,717 |
| Comanche | 0.1 /100 | #282 | Tragic $88,556 |
| Bangladeshis | 0.1 /100 | #283 | Tragic $88,358 |
| Indonesians | 0.1 /100 | #284 | Tragic $88,301 |
| Guatemalans | 0.1 /100 | #285 | Tragic $88,295 |
| Immigrants | Nicaragua | 0.1 /100 | #286 | Tragic $88,267 |
| Potawatomi | 0.1 /100 | #287 | Tragic $88,265 |
| Cherokee | 0.1 /100 | #288 | Tragic $88,209 |
| Central American Indians | 0.1 /100 | #289 | Tragic $88,034 |
| Shoshone | 0.1 /100 | #290 | Tragic $87,872 |
| Immigrants | Cabo Verde | 0.1 /100 | #291 | Tragic $87,830 |
| Africans | 0.1 /100 | #292 | Tragic $87,820 |
| Ute | 0.0 /100 | #293 | Tragic $87,596 |
| Fijians | 0.0 /100 | #294 | Tragic $87,387 |
| Yaqui | 0.0 /100 | #295 | Tragic $87,289 |