Immigrants from Netherlands vs Lithuanian Median Household Income
COMPARE
Immigrants from Netherlands
Lithuanian
Median Household Income
Median Household Income Comparison
Immigrants from Netherlands
Lithuanians
$94,411
MEDIAN HOUSEHOLD INCOME
99.7/ 100
METRIC RATING
64th/ 347
METRIC RANK
$93,852
MEDIAN HOUSEHOLD INCOME
99.6/ 100
METRIC RATING
72nd/ 347
METRIC RANK
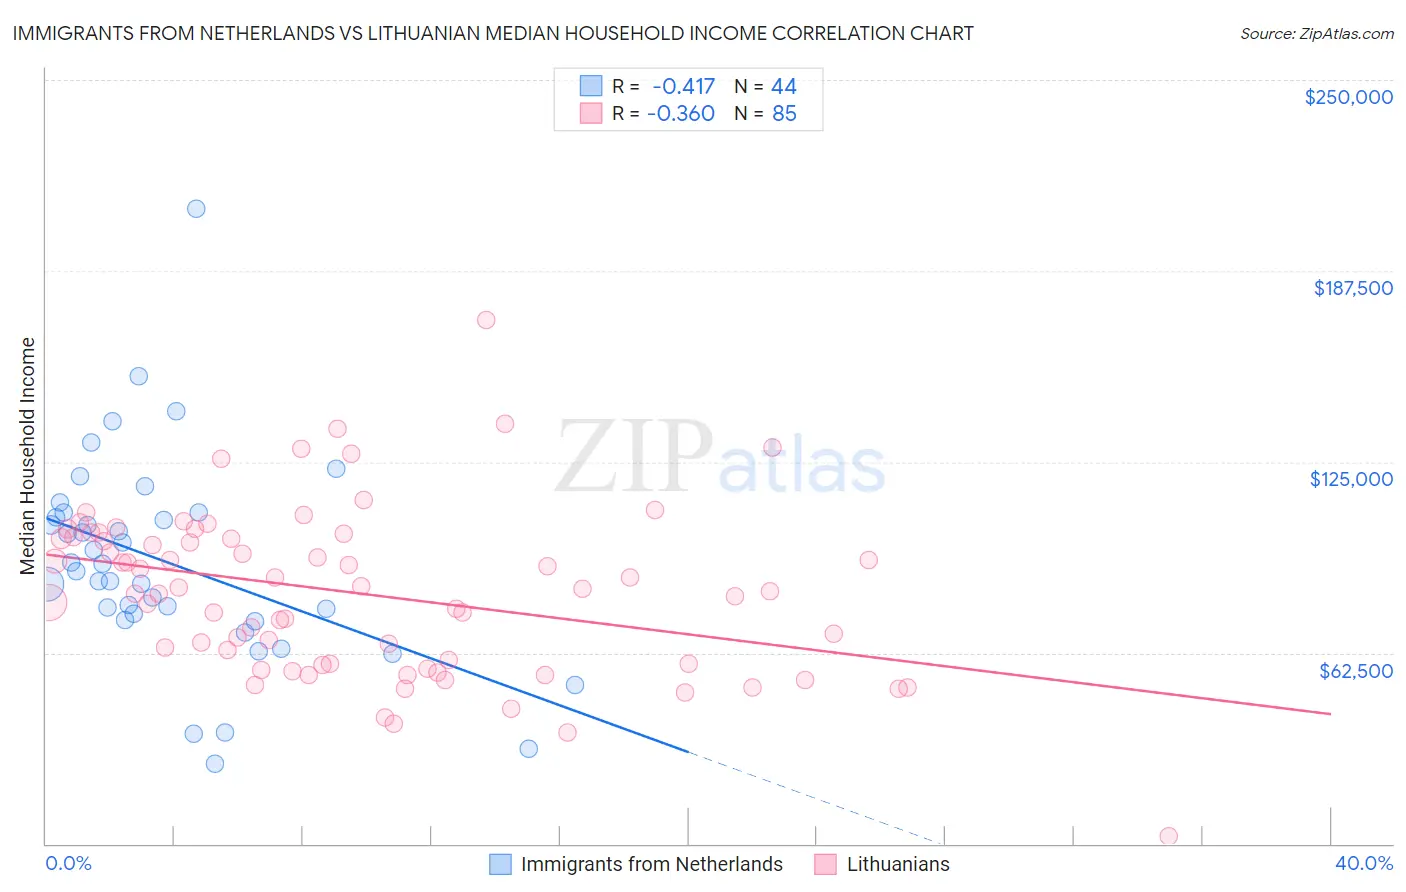
Immigrants from Netherlands vs Lithuanian Median Household Income Correlation Chart
The statistical analysis conducted on geographies consisting of 237,766,506 people shows a moderate negative correlation between the proportion of Immigrants from Netherlands and median household income in the United States with a correlation coefficient (R) of -0.417 and weighted average of $94,411. Similarly, the statistical analysis conducted on geographies consisting of 421,640,790 people shows a mild negative correlation between the proportion of Lithuanians and median household income in the United States with a correlation coefficient (R) of -0.360 and weighted average of $93,852, a difference of 0.60%.
Median Household Income Correlation Summary
| Measurement | Immigrants from Netherlands | Lithuanian |
| Minimum | $26,321 | $2,499 |
| Maximum | $207,847 | $171,528 |
| Range | $181,526 | $169,029 |
| Mean | $92,018 | $81,905 |
| Median | $90,410 | $82,500 |
| Interquartile 25% (IQ1) | $74,172 | $58,701 |
| Interquartile 75% (IQ3) | $107,615 | $100,159 |
| Interquartile Range (IQR) | $33,443 | $41,458 |
| Standard Deviation (Sample) | $33,648 | $27,290 |
| Standard Deviation (Population) | $33,264 | $27,129 |
Demographics Similar to Immigrants from Netherlands and Lithuanians by Median Household Income
In terms of median household income, the demographic groups most similar to Immigrants from Netherlands are Immigrants from Belarus ($94,399, a difference of 0.010%), Immigrants from Romania ($94,222, a difference of 0.20%), Greek ($94,735, a difference of 0.34%), Immigrants from Scotland ($94,091, a difference of 0.34%), and Immigrants from Norway ($94,846, a difference of 0.46%). Similarly, the demographic groups most similar to Lithuanians are Immigrants from Philippines ($93,899, a difference of 0.050%), Immigrants from Fiji ($93,933, a difference of 0.090%), Argentinean ($93,960, a difference of 0.11%), Mongolian ($93,971, a difference of 0.13%), and Immigrants from Egypt ($93,700, a difference of 0.16%).
| Demographics | Rating | Rank | Median Household Income |
| Soviet Union | 99.8 /100 | #58 | Exceptional $95,098 |
| Immigrants | Europe | 99.8 /100 | #59 | Exceptional $95,032 |
| Koreans | 99.8 /100 | #60 | Exceptional $95,018 |
| Laotians | 99.8 /100 | #61 | Exceptional $94,990 |
| Immigrants | Norway | 99.8 /100 | #62 | Exceptional $94,846 |
| Greeks | 99.8 /100 | #63 | Exceptional $94,735 |
| Immigrants | Netherlands | 99.7 /100 | #64 | Exceptional $94,411 |
| Immigrants | Belarus | 99.7 /100 | #65 | Exceptional $94,399 |
| Immigrants | Romania | 99.7 /100 | #66 | Exceptional $94,222 |
| Immigrants | Scotland | 99.7 /100 | #67 | Exceptional $94,091 |
| Mongolians | 99.7 /100 | #68 | Exceptional $93,971 |
| Argentineans | 99.7 /100 | #69 | Exceptional $93,960 |
| Immigrants | Fiji | 99.7 /100 | #70 | Exceptional $93,933 |
| Immigrants | Philippines | 99.6 /100 | #71 | Exceptional $93,899 |
| Lithuanians | 99.6 /100 | #72 | Exceptional $93,852 |
| Immigrants | Egypt | 99.6 /100 | #73 | Exceptional $93,700 |
| Immigrants | Latvia | 99.6 /100 | #74 | Exceptional $93,602 |
| Immigrants | Italy | 99.5 /100 | #75 | Exceptional $93,465 |
| South Africans | 99.5 /100 | #76 | Exceptional $93,379 |
| Immigrants | Afghanistan | 99.5 /100 | #77 | Exceptional $93,375 |
| Immigrants | Bulgaria | 99.4 /100 | #78 | Exceptional $93,148 |