Immigrants from Nepal vs Taiwanese Median Male Earnings
COMPARE
Immigrants from Nepal
Taiwanese
Median Male Earnings
Median Male Earnings Comparison
Immigrants from Nepal
Taiwanese
$55,615
MEDIAN MALE EARNINGS
75.0/ 100
METRIC RATING
153rd/ 347
METRIC RANK
$55,556
MEDIAN MALE EARNINGS
73.9/ 100
METRIC RATING
154th/ 347
METRIC RANK
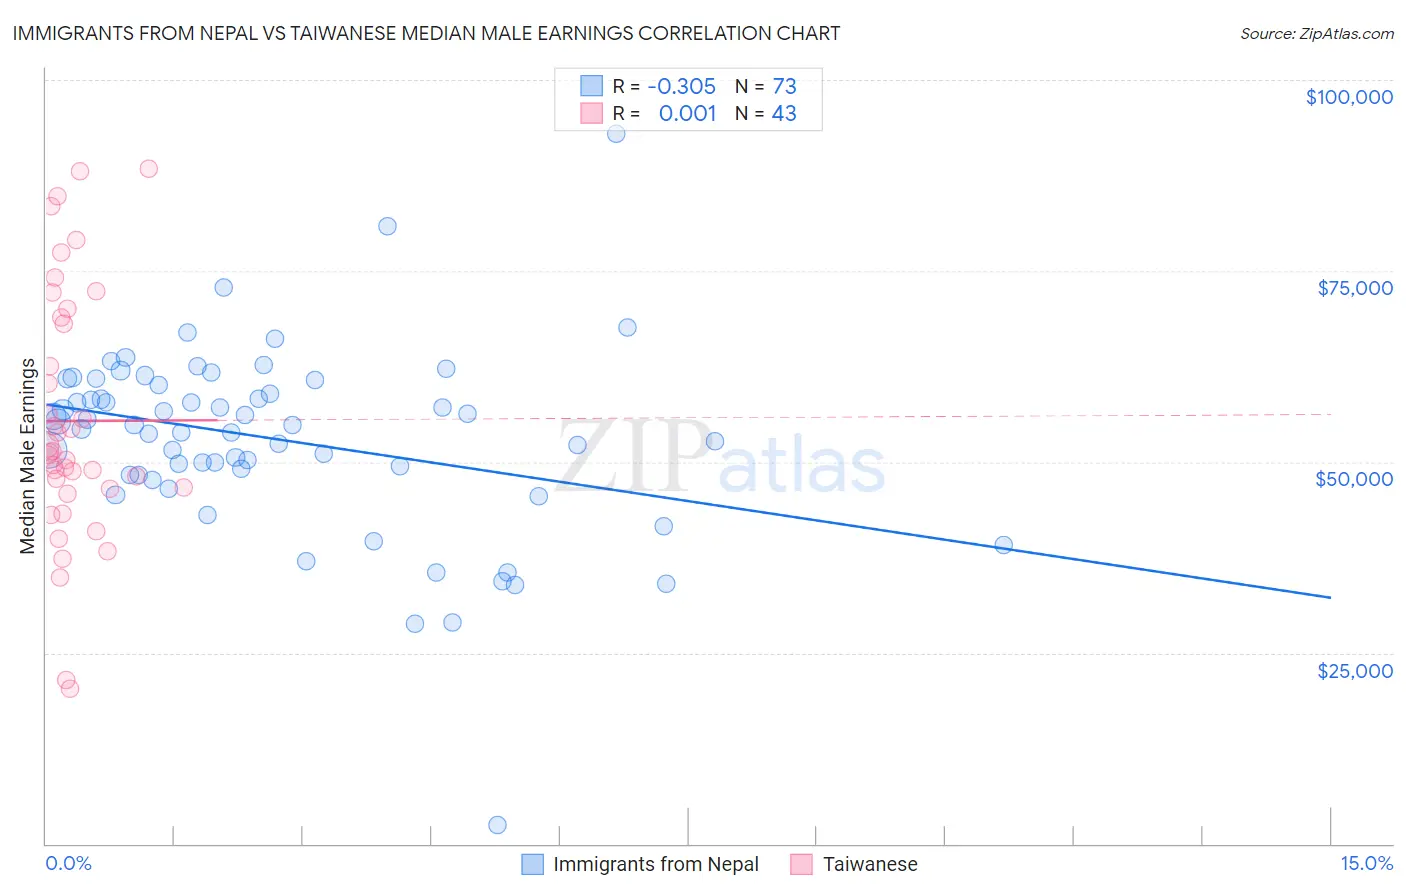
Immigrants from Nepal vs Taiwanese Median Male Earnings Correlation Chart
The statistical analysis conducted on geographies consisting of 186,778,283 people shows a mild negative correlation between the proportion of Immigrants from Nepal and median male earnings in the United States with a correlation coefficient (R) of -0.305 and weighted average of $55,615. Similarly, the statistical analysis conducted on geographies consisting of 31,719,634 people shows no correlation between the proportion of Taiwanese and median male earnings in the United States with a correlation coefficient (R) of 0.001 and weighted average of $55,556, a difference of 0.11%.
Median Male Earnings Correlation Summary
| Measurement | Immigrants from Nepal | Taiwanese |
| Minimum | $2,499 | $20,367 |
| Maximum | $93,000 | $88,333 |
| Range | $90,501 | $67,966 |
| Mean | $52,957 | $55,357 |
| Median | $54,879 | $51,283 |
| Interquartile 25% (IQ1) | $48,301 | $46,547 |
| Interquartile 75% (IQ3) | $60,442 | $68,930 |
| Interquartile Range (IQR) | $12,141 | $22,384 |
| Standard Deviation (Sample) | $12,480 | $16,341 |
| Standard Deviation (Population) | $12,394 | $16,149 |
Demographics Similar to Immigrants from Nepal and Taiwanese by Median Male Earnings
In terms of median male earnings, the demographic groups most similar to Immigrants from Nepal are Peruvian ($55,659, a difference of 0.080%), Scandinavian ($55,527, a difference of 0.16%), Immigrants from Oceania ($55,712, a difference of 0.17%), Swiss ($55,731, a difference of 0.21%), and English ($55,747, a difference of 0.24%). Similarly, the demographic groups most similar to Taiwanese are Scandinavian ($55,527, a difference of 0.050%), Peruvian ($55,659, a difference of 0.19%), Immigrants from Ethiopia ($55,434, a difference of 0.22%), Icelander ($55,415, a difference of 0.25%), and Immigrants from Oceania ($55,712, a difference of 0.28%).
| Demographics | Rating | Rank | Median Male Earnings |
| Sri Lankans | 83.4 /100 | #143 | Excellent $56,136 |
| Immigrants | Uganda | 82.4 /100 | #144 | Excellent $56,064 |
| Norwegians | 80.9 /100 | #145 | Excellent $55,965 |
| Immigrants | Chile | 80.7 /100 | #146 | Excellent $55,954 |
| Immigrants | Philippines | 78.4 /100 | #147 | Good $55,809 |
| Scottish | 78.2 /100 | #148 | Good $55,793 |
| English | 77.4 /100 | #149 | Good $55,747 |
| Swiss | 77.1 /100 | #150 | Good $55,731 |
| Immigrants | Oceania | 76.8 /100 | #151 | Good $55,712 |
| Peruvians | 75.8 /100 | #152 | Good $55,659 |
| Immigrants | Nepal | 75.0 /100 | #153 | Good $55,615 |
| Taiwanese | 73.9 /100 | #154 | Good $55,556 |
| Scandinavians | 73.4 /100 | #155 | Good $55,527 |
| Immigrants | Ethiopia | 71.6 /100 | #156 | Good $55,434 |
| Icelanders | 71.2 /100 | #157 | Good $55,415 |
| Czechoslovakians | 70.5 /100 | #158 | Good $55,382 |
| Alsatians | 70.5 /100 | #159 | Good $55,380 |
| Basques | 70.3 /100 | #160 | Good $55,370 |
| Belgians | 70.1 /100 | #161 | Good $55,361 |
| French | 69.9 /100 | #162 | Good $55,350 |
| Ugandans | 68.6 /100 | #163 | Good $55,290 |