Immigrants from Nepal vs Paiute Median Household Income
COMPARE
Immigrants from Nepal
Paiute
Median Household Income
Median Household Income Comparison
Immigrants from Nepal
Paiute
$87,046
MEDIAN HOUSEHOLD INCOME
77.7/ 100
METRIC RATING
149th/ 347
METRIC RANK
$72,959
MEDIAN HOUSEHOLD INCOME
0.0/ 100
METRIC RATING
298th/ 347
METRIC RANK
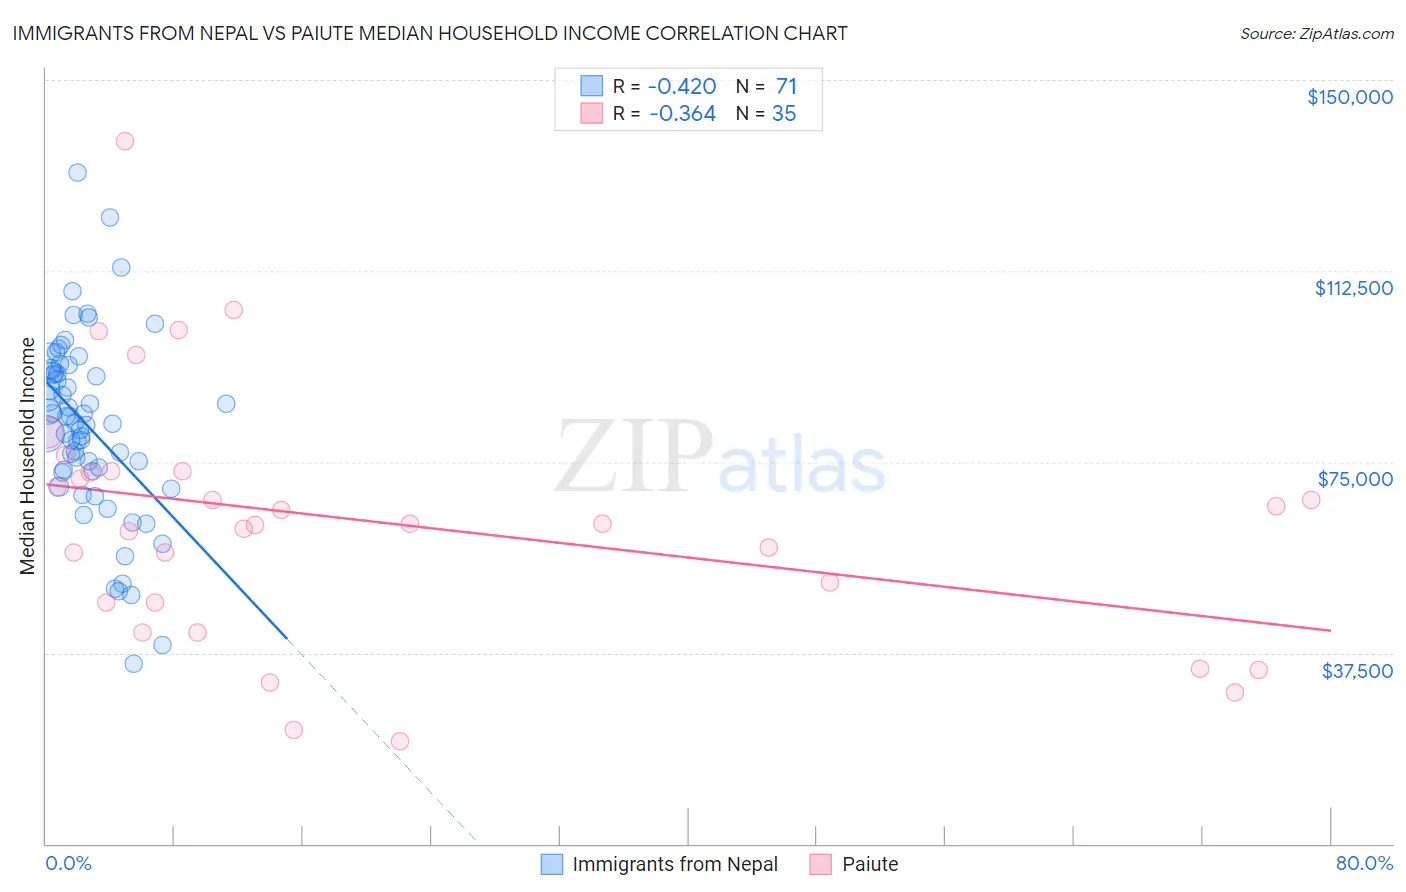
Immigrants from Nepal vs Paiute Median Household Income Correlation Chart
The statistical analysis conducted on geographies consisting of 186,662,148 people shows a moderate negative correlation between the proportion of Immigrants from Nepal and median household income in the United States with a correlation coefficient (R) of -0.420 and weighted average of $87,046. Similarly, the statistical analysis conducted on geographies consisting of 58,395,139 people shows a mild negative correlation between the proportion of Paiute and median household income in the United States with a correlation coefficient (R) of -0.364 and weighted average of $72,959, a difference of 19.3%.
Median Household Income Correlation Summary
| Measurement | Immigrants from Nepal | Paiute |
| Minimum | $35,329 | $20,139 |
| Maximum | $131,777 | $138,043 |
| Range | $96,448 | $117,904 |
| Mean | $81,976 | $63,163 |
| Median | $82,737 | $62,760 |
| Interquartile 25% (IQ1) | $73,125 | $47,361 |
| Interquartile 75% (IQ3) | $92,873 | $73,101 |
| Interquartile Range (IQR) | $19,748 | $25,740 |
| Standard Deviation (Sample) | $17,803 | $24,968 |
| Standard Deviation (Population) | $17,677 | $24,608 |
Similar Demographics by Median Household Income
Demographics Similar to Immigrants from Nepal by Median Household Income
In terms of median household income, the demographic groups most similar to Immigrants from Nepal are Basque ($87,001, a difference of 0.050%), Hungarian ($86,920, a difference of 0.15%), Immigrants from Saudi Arabia ($86,875, a difference of 0.20%), Costa Rican ($87,262, a difference of 0.25%), and South American ($86,824, a difference of 0.26%).
| Demographics | Rating | Rank | Median Household Income |
| Canadians | 84.7 /100 | #142 | Excellent $87,769 |
| Danes | 83.9 /100 | #143 | Excellent $87,676 |
| Serbians | 83.0 /100 | #144 | Excellent $87,572 |
| Ugandans | 82.9 /100 | #145 | Excellent $87,557 |
| Immigrants | Uganda | 82.8 /100 | #146 | Excellent $87,553 |
| South American Indians | 81.8 /100 | #147 | Excellent $87,446 |
| Costa Ricans | 80.0 /100 | #148 | Excellent $87,262 |
| Immigrants | Nepal | 77.7 /100 | #149 | Good $87,046 |
| Basques | 77.2 /100 | #150 | Good $87,001 |
| Hungarians | 76.3 /100 | #151 | Good $86,920 |
| Immigrants | Saudi Arabia | 75.8 /100 | #152 | Good $86,875 |
| South Americans | 75.1 /100 | #153 | Good $86,824 |
| Immigrants | Germany | 74.4 /100 | #154 | Good $86,764 |
| Carpatho Rusyns | 72.8 /100 | #155 | Good $86,635 |
| Immigrants | Albania | 71.5 /100 | #156 | Good $86,534 |
Demographics Similar to Paiute by Median Household Income
In terms of median household income, the demographic groups most similar to Paiute are Indonesian ($72,856, a difference of 0.14%), Immigrants from Mexico ($73,160, a difference of 0.27%), Immigrants from Dominica ($72,760, a difference of 0.27%), Cherokee ($72,682, a difference of 0.38%), and Shoshone ($72,660, a difference of 0.41%).
| Demographics | Rating | Rank | Median Household Income |
| Hispanics or Latinos | 0.1 /100 | #291 | Tragic $73,823 |
| Comanche | 0.1 /100 | #292 | Tragic $73,747 |
| Immigrants | Cabo Verde | 0.1 /100 | #293 | Tragic $73,515 |
| Blackfeet | 0.1 /100 | #294 | Tragic $73,509 |
| Cubans | 0.1 /100 | #295 | Tragic $73,392 |
| Haitians | 0.1 /100 | #296 | Tragic $73,306 |
| Immigrants | Mexico | 0.0 /100 | #297 | Tragic $73,160 |
| Paiute | 0.0 /100 | #298 | Tragic $72,959 |
| Indonesians | 0.0 /100 | #299 | Tragic $72,856 |
| Immigrants | Dominica | 0.0 /100 | #300 | Tragic $72,760 |
| Cherokee | 0.0 /100 | #301 | Tragic $72,682 |
| Shoshone | 0.0 /100 | #302 | Tragic $72,660 |
| Africans | 0.0 /100 | #303 | Tragic $72,650 |
| Immigrants | Haiti | 0.0 /100 | #304 | Tragic $72,599 |
| Hondurans | 0.0 /100 | #305 | Tragic $72,588 |