Immigrants from Middle Africa vs Immigrants from Romania Householder Income Under 25 years
COMPARE
Immigrants from Middle Africa
Immigrants from Romania
Householder Income Under 25 years
Householder Income Under 25 years Comparison
Immigrants from Middle Africa
Immigrants from Romania
$47,916
HOUSEHOLDER INCOME UNDER 25 YEARS
0.0/ 100
METRIC RATING
303rd/ 347
METRIC RANK
$55,522
HOUSEHOLDER INCOME UNDER 25 YEARS
100.0/ 100
METRIC RATING
51st/ 347
METRIC RANK
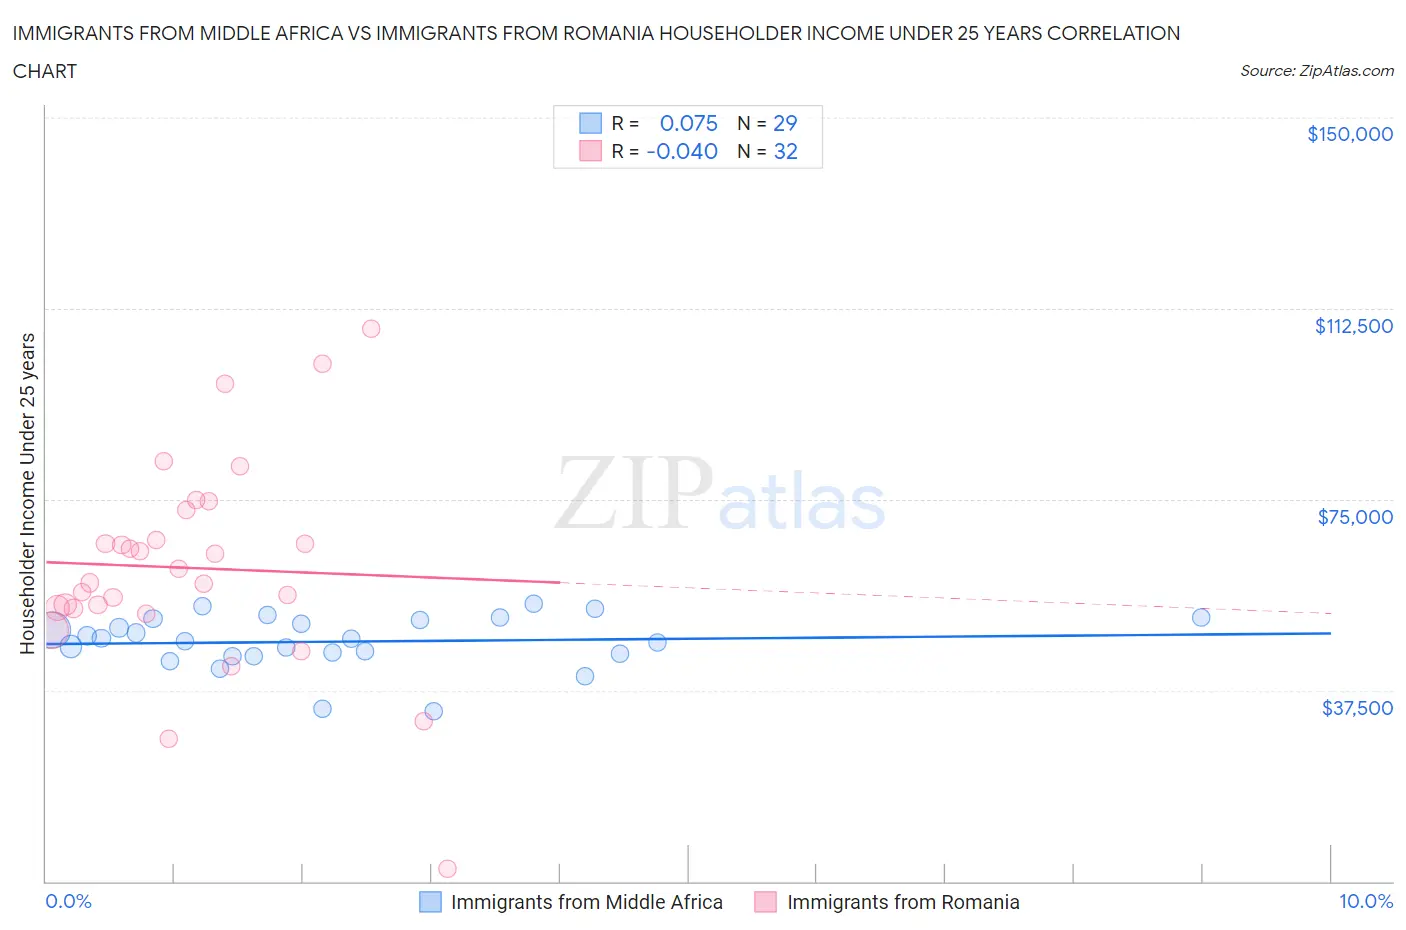
Immigrants from Middle Africa vs Immigrants from Romania Householder Income Under 25 years Correlation Chart
The statistical analysis conducted on geographies consisting of 185,124,339 people shows a slight positive correlation between the proportion of Immigrants from Middle Africa and household income with householder under the age of 25 in the United States with a correlation coefficient (R) of 0.075 and weighted average of $47,916. Similarly, the statistical analysis conducted on geographies consisting of 223,431,130 people shows no correlation between the proportion of Immigrants from Romania and household income with householder under the age of 25 in the United States with a correlation coefficient (R) of -0.040 and weighted average of $55,522, a difference of 15.9%.
Householder Income Under 25 years Correlation Summary
| Measurement | Immigrants from Middle Africa | Immigrants from Romania |
| Minimum | $33,425 | $2,499 |
| Maximum | $54,425 | $108,452 |
| Range | $21,000 | $105,953 |
| Mean | $47,045 | $61,531 |
| Median | $47,736 | $59,956 |
| Interquartile 25% (IQ1) | $44,499 | $53,639 |
| Interquartile 75% (IQ3) | $51,465 | $70,028 |
| Interquartile Range (IQR) | $6,966 | $16,389 |
| Standard Deviation (Sample) | $5,237 | $20,715 |
| Standard Deviation (Population) | $5,146 | $20,389 |
Similar Demographics by Householder Income Under 25 years
Demographics Similar to Immigrants from Middle Africa by Householder Income Under 25 years
In terms of householder income under 25 years, the demographic groups most similar to Immigrants from Middle Africa are Menominee ($47,907, a difference of 0.020%), Immigrants from Liberia ($47,981, a difference of 0.14%), Cherokee ($47,848, a difference of 0.14%), Immigrants from Kuwait ($48,126, a difference of 0.44%), and Native/Alaskan ($47,704, a difference of 0.44%).
| Demographics | Rating | Rank | Householder Income Under 25 years |
| Blackfeet | 0.0 /100 | #296 | Tragic $48,603 |
| Cree | 0.0 /100 | #297 | Tragic $48,514 |
| Yaqui | 0.0 /100 | #298 | Tragic $48,300 |
| Immigrants | Honduras | 0.0 /100 | #299 | Tragic $48,267 |
| Immigrants | Somalia | 0.0 /100 | #300 | Tragic $48,135 |
| Immigrants | Kuwait | 0.0 /100 | #301 | Tragic $48,126 |
| Immigrants | Liberia | 0.0 /100 | #302 | Tragic $47,981 |
| Immigrants | Middle Africa | 0.0 /100 | #303 | Tragic $47,916 |
| Menominee | 0.0 /100 | #304 | Tragic $47,907 |
| Cherokee | 0.0 /100 | #305 | Tragic $47,848 |
| Natives/Alaskans | 0.0 /100 | #306 | Tragic $47,704 |
| Bangladeshis | 0.0 /100 | #307 | Tragic $47,589 |
| Comanche | 0.0 /100 | #308 | Tragic $47,518 |
| U.S. Virgin Islanders | 0.0 /100 | #309 | Tragic $47,448 |
| Iroquois | 0.0 /100 | #310 | Tragic $47,380 |
Demographics Similar to Immigrants from Romania by Householder Income Under 25 years
In terms of householder income under 25 years, the demographic groups most similar to Immigrants from Romania are Immigrants from Indonesia ($55,521, a difference of 0.0%), Puget Sound Salish ($55,543, a difference of 0.040%), Iranian ($55,548, a difference of 0.050%), Immigrants from Vietnam ($55,562, a difference of 0.070%), and Spanish American Indian ($55,573, a difference of 0.090%).
| Demographics | Rating | Rank | Householder Income Under 25 years |
| Paraguayans | 100.0 /100 | #44 | Exceptional $55,614 |
| Spanish American Indians | 100.0 /100 | #45 | Exceptional $55,573 |
| Immigrants | Eastern Europe | 100.0 /100 | #46 | Exceptional $55,572 |
| Cambodians | 100.0 /100 | #47 | Exceptional $55,571 |
| Immigrants | Vietnam | 100.0 /100 | #48 | Exceptional $55,562 |
| Iranians | 100.0 /100 | #49 | Exceptional $55,548 |
| Puget Sound Salish | 100.0 /100 | #50 | Exceptional $55,543 |
| Immigrants | Romania | 100.0 /100 | #51 | Exceptional $55,522 |
| Immigrants | Indonesia | 100.0 /100 | #52 | Exceptional $55,521 |
| Immigrants | Poland | 100.0 /100 | #53 | Exceptional $55,474 |
| Sri Lankans | 100.0 /100 | #54 | Exceptional $55,470 |
| Immigrants | Ukraine | 100.0 /100 | #55 | Exceptional $55,447 |
| Salvadorans | 100.0 /100 | #56 | Exceptional $55,412 |
| Soviet Union | 100.0 /100 | #57 | Exceptional $55,340 |
| Guyanese | 99.9 /100 | #58 | Exceptional $55,210 |