Immigrants from Micronesia vs Spanish American Median Female Earnings
COMPARE
Immigrants from Micronesia
Spanish American
Median Female Earnings
Median Female Earnings Comparison
Immigrants from Micronesia
Spanish Americans
$35,477
MEDIAN FEMALE EARNINGS
0.0/ 100
METRIC RATING
298th/ 347
METRIC RANK
$36,391
MEDIAN FEMALE EARNINGS
0.1/ 100
METRIC RATING
281st/ 347
METRIC RANK
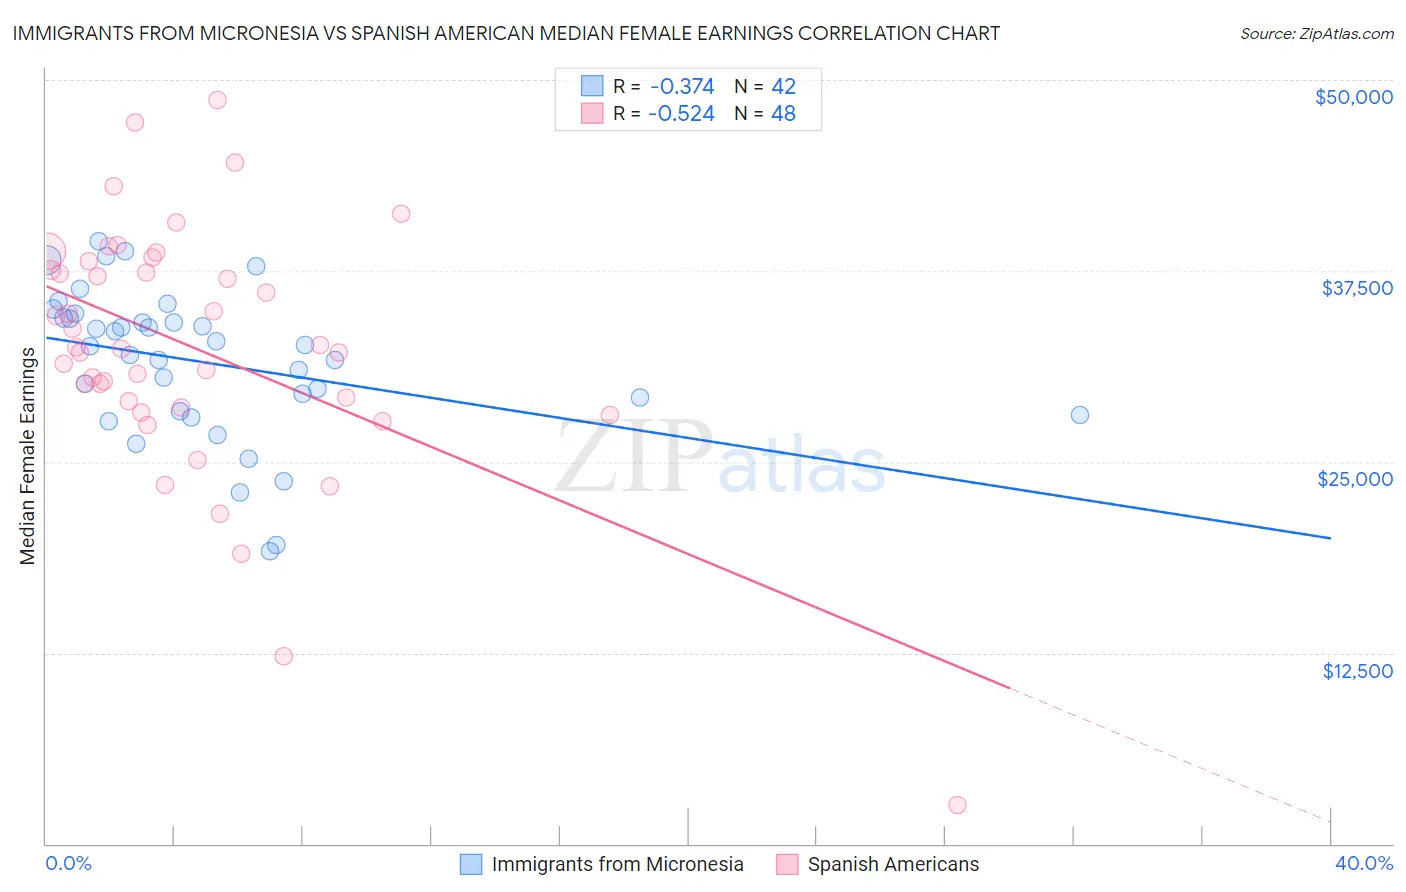
Immigrants from Micronesia vs Spanish American Median Female Earnings Correlation Chart
The statistical analysis conducted on geographies consisting of 61,601,305 people shows a mild negative correlation between the proportion of Immigrants from Micronesia and median female earnings in the United States with a correlation coefficient (R) of -0.374 and weighted average of $35,477. Similarly, the statistical analysis conducted on geographies consisting of 103,144,133 people shows a substantial negative correlation between the proportion of Spanish Americans and median female earnings in the United States with a correlation coefficient (R) of -0.524 and weighted average of $36,391, a difference of 2.6%.
Median Female Earnings Correlation Summary
| Measurement | Immigrants from Micronesia | Spanish American |
| Minimum | $19,167 | $2,499 |
| Maximum | $39,412 | $48,712 |
| Range | $20,245 | $46,213 |
| Mean | $31,538 | $32,492 |
| Median | $32,587 | $32,451 |
| Interquartile 25% (IQ1) | $28,333 | $28,756 |
| Interquartile 75% (IQ3) | $34,418 | $37,829 |
| Interquartile Range (IQR) | $6,085 | $9,073 |
| Standard Deviation (Sample) | $4,851 | $8,307 |
| Standard Deviation (Population) | $4,793 | $8,220 |
Demographics Similar to Immigrants from Micronesia and Spanish Americans by Median Female Earnings
In terms of median female earnings, the demographic groups most similar to Immigrants from Micronesia are Hmong ($35,498, a difference of 0.060%), Immigrants from Guatemala ($35,444, a difference of 0.090%), Mexican American Indian ($35,629, a difference of 0.43%), Comanche ($35,661, a difference of 0.52%), and Cheyenne ($35,673, a difference of 0.55%). Similarly, the demographic groups most similar to Spanish Americans are Iroquois ($36,408, a difference of 0.050%), Haitian ($36,374, a difference of 0.050%), Immigrants from Caribbean ($36,414, a difference of 0.060%), Immigrants from Haiti ($36,203, a difference of 0.52%), and Indonesian ($36,140, a difference of 0.69%).
| Demographics | Rating | Rank | Median Female Earnings |
| Immigrants | Caribbean | 0.1 /100 | #279 | Tragic $36,414 |
| Iroquois | 0.1 /100 | #280 | Tragic $36,408 |
| Spanish Americans | 0.1 /100 | #281 | Tragic $36,391 |
| Haitians | 0.1 /100 | #282 | Tragic $36,374 |
| Immigrants | Haiti | 0.1 /100 | #283 | Tragic $36,203 |
| Indonesians | 0.1 /100 | #284 | Tragic $36,140 |
| Paiute | 0.1 /100 | #285 | Tragic $36,056 |
| Osage | 0.0 /100 | #286 | Tragic $36,034 |
| Immigrants | Nicaragua | 0.0 /100 | #287 | Tragic $36,023 |
| Immigrants | Zaire | 0.0 /100 | #288 | Tragic $36,017 |
| Bangladeshis | 0.0 /100 | #289 | Tragic $35,960 |
| Central American Indians | 0.0 /100 | #290 | Tragic $35,930 |
| Blackfeet | 0.0 /100 | #291 | Tragic $35,864 |
| Americans | 0.0 /100 | #292 | Tragic $35,777 |
| Guatemalans | 0.0 /100 | #293 | Tragic $35,695 |
| Cheyenne | 0.0 /100 | #294 | Tragic $35,673 |
| Comanche | 0.0 /100 | #295 | Tragic $35,661 |
| Mexican American Indians | 0.0 /100 | #296 | Tragic $35,629 |
| Hmong | 0.0 /100 | #297 | Tragic $35,498 |
| Immigrants | Micronesia | 0.0 /100 | #298 | Tragic $35,477 |
| Immigrants | Guatemala | 0.0 /100 | #299 | Tragic $35,444 |