Immigrants from Micronesia vs South American Householder Income Over 65 years
COMPARE
Immigrants from Micronesia
South American
Householder Income Over 65 years
Householder Income Over 65 years Comparison
Immigrants from Micronesia
South Americans
$61,000
HOUSEHOLDER INCOME OVER 65 YEARS
50.8/ 100
METRIC RATING
173rd/ 347
METRIC RANK
$59,854
HOUSEHOLDER INCOME OVER 65 YEARS
23.8/ 100
METRIC RATING
192nd/ 347
METRIC RANK
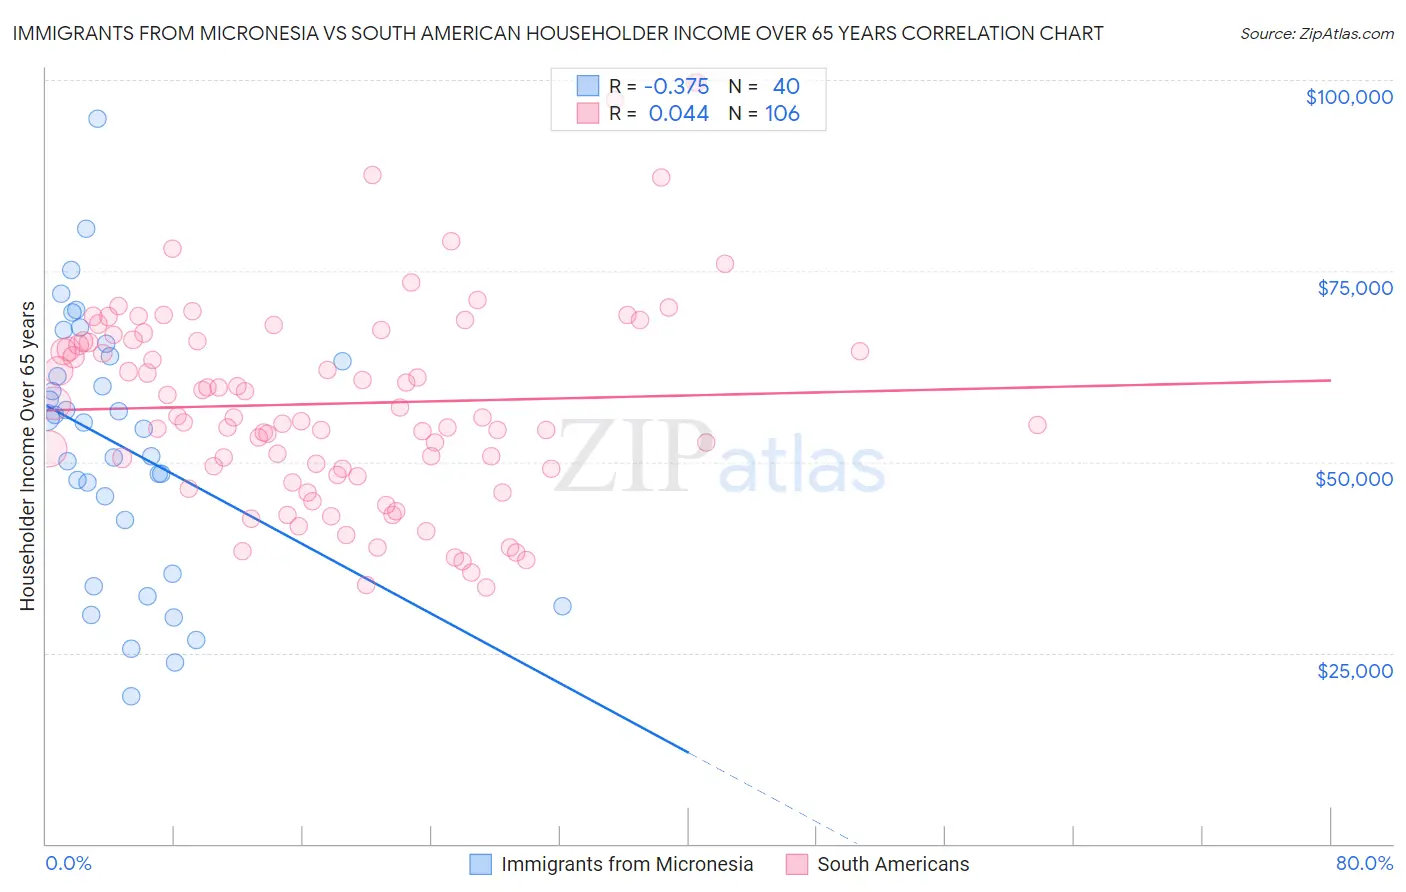
Immigrants from Micronesia vs South American Householder Income Over 65 years Correlation Chart
The statistical analysis conducted on geographies consisting of 61,368,968 people shows a mild negative correlation between the proportion of Immigrants from Micronesia and household income with householder over the age of 65 in the United States with a correlation coefficient (R) of -0.375 and weighted average of $61,000. Similarly, the statistical analysis conducted on geographies consisting of 491,344,983 people shows no correlation between the proportion of South Americans and household income with householder over the age of 65 in the United States with a correlation coefficient (R) of 0.044 and weighted average of $59,854, a difference of 1.9%.
Householder Income Over 65 years Correlation Summary
| Measurement | Immigrants from Micronesia | South American |
| Minimum | $19,375 | $33,510 |
| Maximum | $94,868 | $99,659 |
| Range | $75,493 | $66,149 |
| Mean | $52,032 | $57,616 |
| Median | $54,757 | $55,802 |
| Interquartile 25% (IQ1) | $38,889 | $49,066 |
| Interquartile 75% (IQ3) | $63,458 | $65,825 |
| Interquartile Range (IQR) | $24,569 | $16,759 |
| Standard Deviation (Sample) | $17,019 | $13,490 |
| Standard Deviation (Population) | $16,805 | $13,426 |
Demographics Similar to Immigrants from Micronesia and South Americans by Householder Income Over 65 years
In terms of householder income over 65 years, the demographic groups most similar to Immigrants from Micronesia are Luxembourger ($60,967, a difference of 0.050%), Immigrants from Poland ($61,041, a difference of 0.070%), Spaniard ($60,866, a difference of 0.22%), Spanish ($60,795, a difference of 0.34%), and Alaska Native ($60,748, a difference of 0.41%). Similarly, the demographic groups most similar to South Americans are Belgian ($59,915, a difference of 0.10%), Puget Sound Salish ($59,934, a difference of 0.13%), Ghanaian ($60,043, a difference of 0.32%), Immigrants from Eritrea ($60,096, a difference of 0.40%), and Immigrants from Thailand ($60,217, a difference of 0.61%).
| Demographics | Rating | Rank | Householder Income Over 65 years |
| Immigrants | Poland | 51.9 /100 | #172 | Average $61,041 |
| Immigrants | Micronesia | 50.8 /100 | #173 | Average $61,000 |
| Luxembourgers | 50.0 /100 | #174 | Average $60,967 |
| Spaniards | 47.3 /100 | #175 | Average $60,866 |
| Spanish | 45.5 /100 | #176 | Average $60,795 |
| Alaska Natives | 44.3 /100 | #177 | Average $60,748 |
| Yup'ik | 43.7 /100 | #178 | Average $60,727 |
| Welsh | 42.2 /100 | #179 | Average $60,666 |
| Immigrants | Morocco | 41.7 /100 | #180 | Average $60,647 |
| Celtics | 40.7 /100 | #181 | Average $60,608 |
| Czechoslovakians | 40.0 /100 | #182 | Average $60,581 |
| Kenyans | 38.4 /100 | #183 | Fair $60,514 |
| Iraqis | 37.2 /100 | #184 | Fair $60,466 |
| Albanians | 32.0 /100 | #185 | Fair $60,249 |
| Slovenes | 31.8 /100 | #186 | Fair $60,241 |
| Immigrants | Thailand | 31.3 /100 | #187 | Fair $60,217 |
| Immigrants | Eritrea | 28.6 /100 | #188 | Fair $60,096 |
| Ghanaians | 27.5 /100 | #189 | Fair $60,043 |
| Puget Sound Salish | 25.3 /100 | #190 | Fair $59,934 |
| Belgians | 24.9 /100 | #191 | Fair $59,915 |
| South Americans | 23.8 /100 | #192 | Fair $59,854 |