Immigrants from Micronesia vs Blackfeet Householder Income Ages 45 - 64 years
COMPARE
Immigrants from Micronesia
Blackfeet
Householder Income Ages 45 - 64 years
Householder Income Ages 45 - 64 years Comparison
Immigrants from Micronesia
Blackfeet
$87,864
HOUSEHOLDER INCOME AGES 45 - 64 YEARS
0.2/ 100
METRIC RATING
268th/ 347
METRIC RANK
$86,595
HOUSEHOLDER INCOME AGES 45 - 64 YEARS
0.1/ 100
METRIC RATING
285th/ 347
METRIC RANK
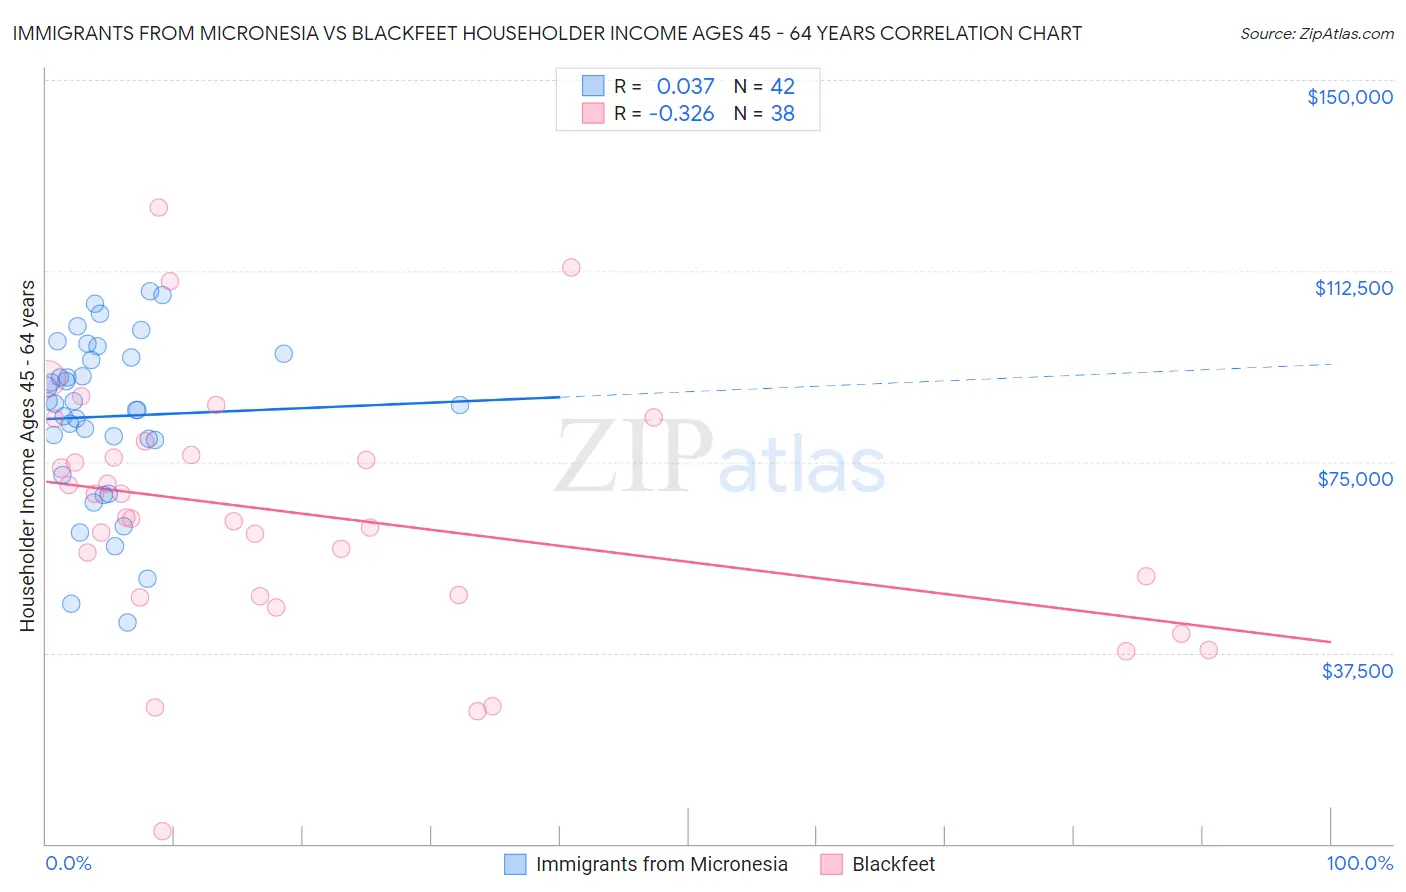
Immigrants from Micronesia vs Blackfeet Householder Income Ages 45 - 64 years Correlation Chart
The statistical analysis conducted on geographies consisting of 61,565,628 people shows no correlation between the proportion of Immigrants from Micronesia and household income with householder between the ages 45 and 64 in the United States with a correlation coefficient (R) of 0.037 and weighted average of $87,864. Similarly, the statistical analysis conducted on geographies consisting of 309,065,778 people shows a mild negative correlation between the proportion of Blackfeet and household income with householder between the ages 45 and 64 in the United States with a correlation coefficient (R) of -0.326 and weighted average of $86,595, a difference of 1.5%.
Householder Income Ages 45 - 64 years Correlation Summary
| Measurement | Immigrants from Micronesia | Blackfeet |
| Minimum | $43,523 | $2,499 |
| Maximum | $108,482 | $124,961 |
| Range | $64,959 | $122,462 |
| Mean | $83,933 | $64,472 |
| Median | $86,276 | $63,965 |
| Interquartile 25% (IQ1) | $79,375 | $48,500 |
| Interquartile 75% (IQ3) | $95,598 | $76,463 |
| Interquartile Range (IQR) | $16,223 | $27,963 |
| Standard Deviation (Sample) | $16,111 | $24,942 |
| Standard Deviation (Population) | $15,918 | $24,611 |
Demographics Similar to Immigrants from Micronesia and Blackfeet by Householder Income Ages 45 - 64 years
In terms of householder income ages 45 - 64 years, the demographic groups most similar to Immigrants from Micronesia are Spanish American ($87,836, a difference of 0.030%), Immigrants from Liberia ($87,739, a difference of 0.14%), Guatemalan ($87,705, a difference of 0.18%), Hmong ($88,115, a difference of 0.29%), and Cape Verdean ($87,580, a difference of 0.32%). Similarly, the demographic groups most similar to Blackfeet are Immigrants from Guatemala ($86,573, a difference of 0.030%), Central American Indian ($86,764, a difference of 0.20%), Mexican ($86,816, a difference of 0.25%), Senegalese ($86,897, a difference of 0.35%), and Yaqui ($86,914, a difference of 0.37%).
| Demographics | Rating | Rank | Householder Income Ages 45 - 64 years |
| Immigrants | West Indies | 0.2 /100 | #266 | Tragic $88,164 |
| Hmong | 0.2 /100 | #267 | Tragic $88,115 |
| Immigrants | Micronesia | 0.2 /100 | #268 | Tragic $87,864 |
| Spanish Americans | 0.2 /100 | #269 | Tragic $87,836 |
| Immigrants | Liberia | 0.2 /100 | #270 | Tragic $87,739 |
| Guatemalans | 0.2 /100 | #271 | Tragic $87,705 |
| Cape Verdeans | 0.2 /100 | #272 | Tragic $87,580 |
| Spanish American Indians | 0.2 /100 | #273 | Tragic $87,561 |
| Iroquois | 0.1 /100 | #274 | Tragic $87,255 |
| Immigrants | Belize | 0.1 /100 | #275 | Tragic $87,229 |
| Immigrants | Latin America | 0.1 /100 | #276 | Tragic $87,219 |
| Cree | 0.1 /100 | #277 | Tragic $87,185 |
| Immigrants | Jamaica | 0.1 /100 | #278 | Tragic $87,035 |
| Yakama | 0.1 /100 | #279 | Tragic $86,992 |
| Immigrants | Somalia | 0.1 /100 | #280 | Tragic $86,987 |
| Yaqui | 0.1 /100 | #281 | Tragic $86,914 |
| Senegalese | 0.1 /100 | #282 | Tragic $86,897 |
| Mexicans | 0.1 /100 | #283 | Tragic $86,816 |
| Central American Indians | 0.1 /100 | #284 | Tragic $86,764 |
| Blackfeet | 0.1 /100 | #285 | Tragic $86,595 |
| Immigrants | Guatemala | 0.1 /100 | #286 | Tragic $86,573 |