Immigrants from Micronesia vs Bahamian Householder Income Under 25 years
COMPARE
Immigrants from Micronesia
Bahamian
Householder Income Under 25 years
Householder Income Under 25 years Comparison
Immigrants from Micronesia
Bahamians
$50,691
HOUSEHOLDER INCOME UNDER 25 YEARS
2.5/ 100
METRIC RATING
241st/ 347
METRIC RANK
$45,743
HOUSEHOLDER INCOME UNDER 25 YEARS
0.0/ 100
METRIC RATING
327th/ 347
METRIC RANK
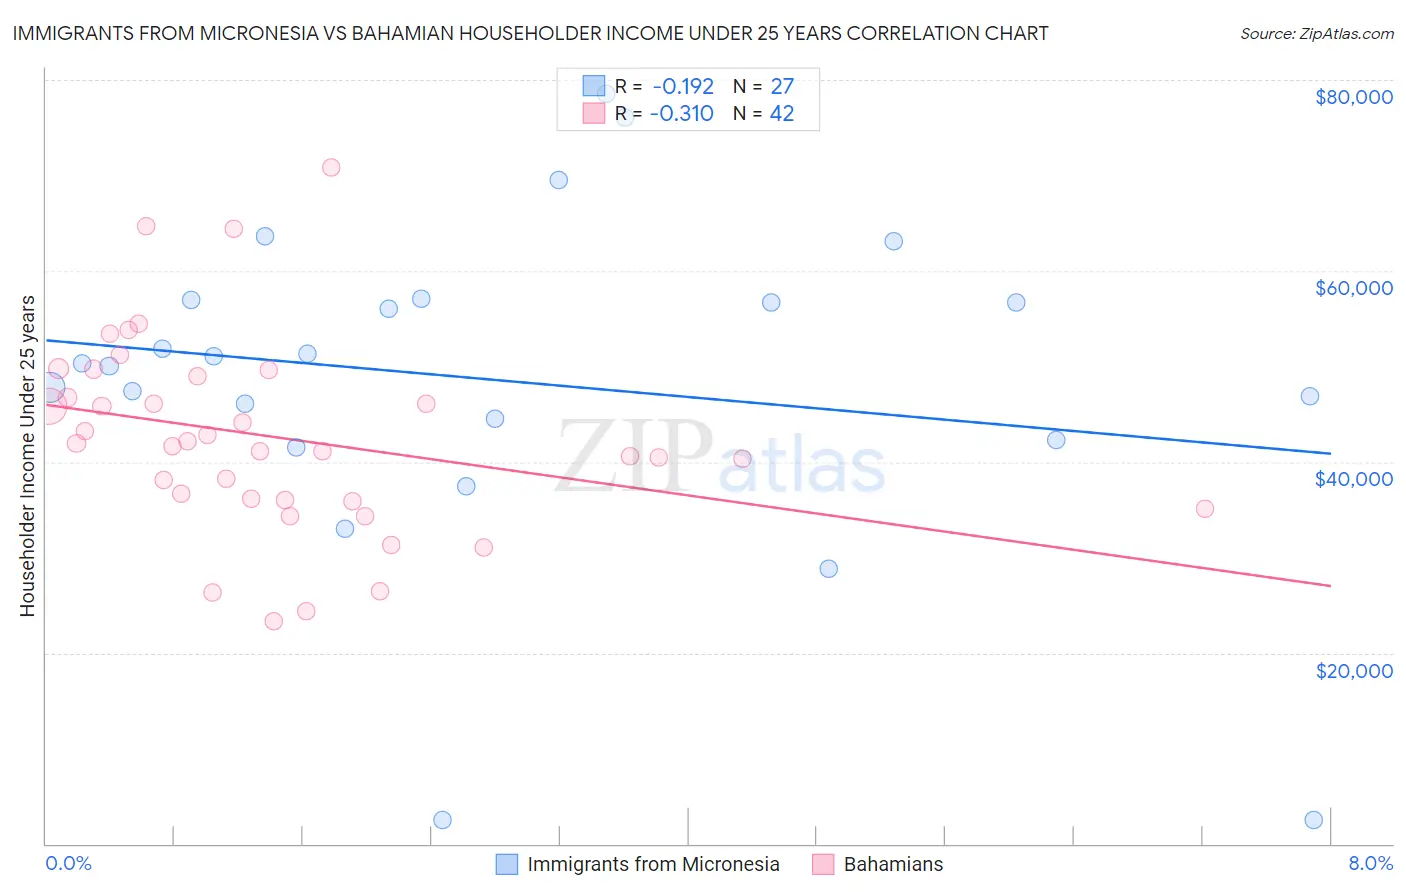
Immigrants from Micronesia vs Bahamian Householder Income Under 25 years Correlation Chart
The statistical analysis conducted on geographies consisting of 59,129,398 people shows a poor negative correlation between the proportion of Immigrants from Micronesia and household income with householder under the age of 25 in the United States with a correlation coefficient (R) of -0.192 and weighted average of $50,691. Similarly, the statistical analysis conducted on geographies consisting of 104,021,755 people shows a mild negative correlation between the proportion of Bahamians and household income with householder under the age of 25 in the United States with a correlation coefficient (R) of -0.310 and weighted average of $45,743, a difference of 10.8%.
Householder Income Under 25 years Correlation Summary
| Measurement | Immigrants from Micronesia | Bahamian |
| Minimum | $2,499 | $23,250 |
| Maximum | $78,500 | $70,795 |
| Range | $76,001 | $47,545 |
| Mean | $48,503 | $42,583 |
| Median | $50,317 | $41,783 |
| Interquartile 25% (IQ1) | $42,250 | $36,008 |
| Interquartile 75% (IQ3) | $57,007 | $48,918 |
| Interquartile Range (IQR) | $14,757 | $12,910 |
| Standard Deviation (Sample) | $17,553 | $10,344 |
| Standard Deviation (Population) | $17,225 | $10,220 |
Similar Demographics by Householder Income Under 25 years
Demographics Similar to Immigrants from Micronesia by Householder Income Under 25 years
In terms of householder income under 25 years, the demographic groups most similar to Immigrants from Micronesia are Cuban ($50,655, a difference of 0.070%), Immigrants from Lebanon ($50,729, a difference of 0.080%), Immigrants from Thailand ($50,645, a difference of 0.090%), Marshallese ($50,627, a difference of 0.12%), and Immigrants from Caribbean ($50,757, a difference of 0.13%).
| Demographics | Rating | Rank | Householder Income Under 25 years |
| Kenyans | 3.3 /100 | #234 | Tragic $50,815 |
| Spanish | 3.3 /100 | #235 | Tragic $50,813 |
| English | 3.3 /100 | #236 | Tragic $50,805 |
| Germans | 3.3 /100 | #237 | Tragic $50,804 |
| Iraqis | 3.2 /100 | #238 | Tragic $50,802 |
| Immigrants | Caribbean | 2.9 /100 | #239 | Tragic $50,757 |
| Immigrants | Lebanon | 2.7 /100 | #240 | Tragic $50,729 |
| Immigrants | Micronesia | 2.5 /100 | #241 | Tragic $50,691 |
| Cubans | 2.3 /100 | #242 | Tragic $50,655 |
| Immigrants | Thailand | 2.2 /100 | #243 | Tragic $50,645 |
| Marshallese | 2.1 /100 | #244 | Tragic $50,627 |
| Immigrants | Africa | 2.0 /100 | #245 | Tragic $50,609 |
| Welsh | 2.0 /100 | #246 | Tragic $50,597 |
| Immigrants | Bosnia and Herzegovina | 1.8 /100 | #247 | Tragic $50,565 |
| Slavs | 1.8 /100 | #248 | Tragic $50,563 |
Demographics Similar to Bahamians by Householder Income Under 25 years
In terms of householder income under 25 years, the demographic groups most similar to Bahamians are Osage ($45,764, a difference of 0.050%), Immigrants from Bahamas ($45,793, a difference of 0.11%), German Russian ($45,673, a difference of 0.15%), Dutch West Indian ($45,816, a difference of 0.16%), and Seminole ($45,649, a difference of 0.21%).
| Demographics | Rating | Rank | Householder Income Under 25 years |
| Immigrants | Sudan | 0.0 /100 | #320 | Tragic $46,791 |
| Potawatomi | 0.0 /100 | #321 | Tragic $46,462 |
| Sioux | 0.0 /100 | #322 | Tragic $46,417 |
| Immigrants | Saudi Arabia | 0.0 /100 | #323 | Tragic $46,187 |
| Dutch West Indians | 0.0 /100 | #324 | Tragic $45,816 |
| Immigrants | Bahamas | 0.0 /100 | #325 | Tragic $45,793 |
| Osage | 0.0 /100 | #326 | Tragic $45,764 |
| Bahamians | 0.0 /100 | #327 | Tragic $45,743 |
| German Russians | 0.0 /100 | #328 | Tragic $45,673 |
| Seminole | 0.0 /100 | #329 | Tragic $45,649 |
| Indonesians | 0.0 /100 | #330 | Tragic $45,566 |
| Immigrants | Zaire | 0.0 /100 | #331 | Tragic $45,529 |
| Choctaw | 0.0 /100 | #332 | Tragic $45,450 |
| Creek | 0.0 /100 | #333 | Tragic $45,371 |
| Cajuns | 0.0 /100 | #334 | Tragic $45,338 |