Immigrants from Mexico vs Honduran Median Male Earnings
COMPARE
Immigrants from Mexico
Honduran
Median Male Earnings
Median Male Earnings Comparison
Immigrants from Mexico
Hondurans
$44,960
MEDIAN MALE EARNINGS
0.0/ 100
METRIC RATING
330th/ 347
METRIC RANK
$46,374
MEDIAN MALE EARNINGS
0.0/ 100
METRIC RATING
313th/ 347
METRIC RANK
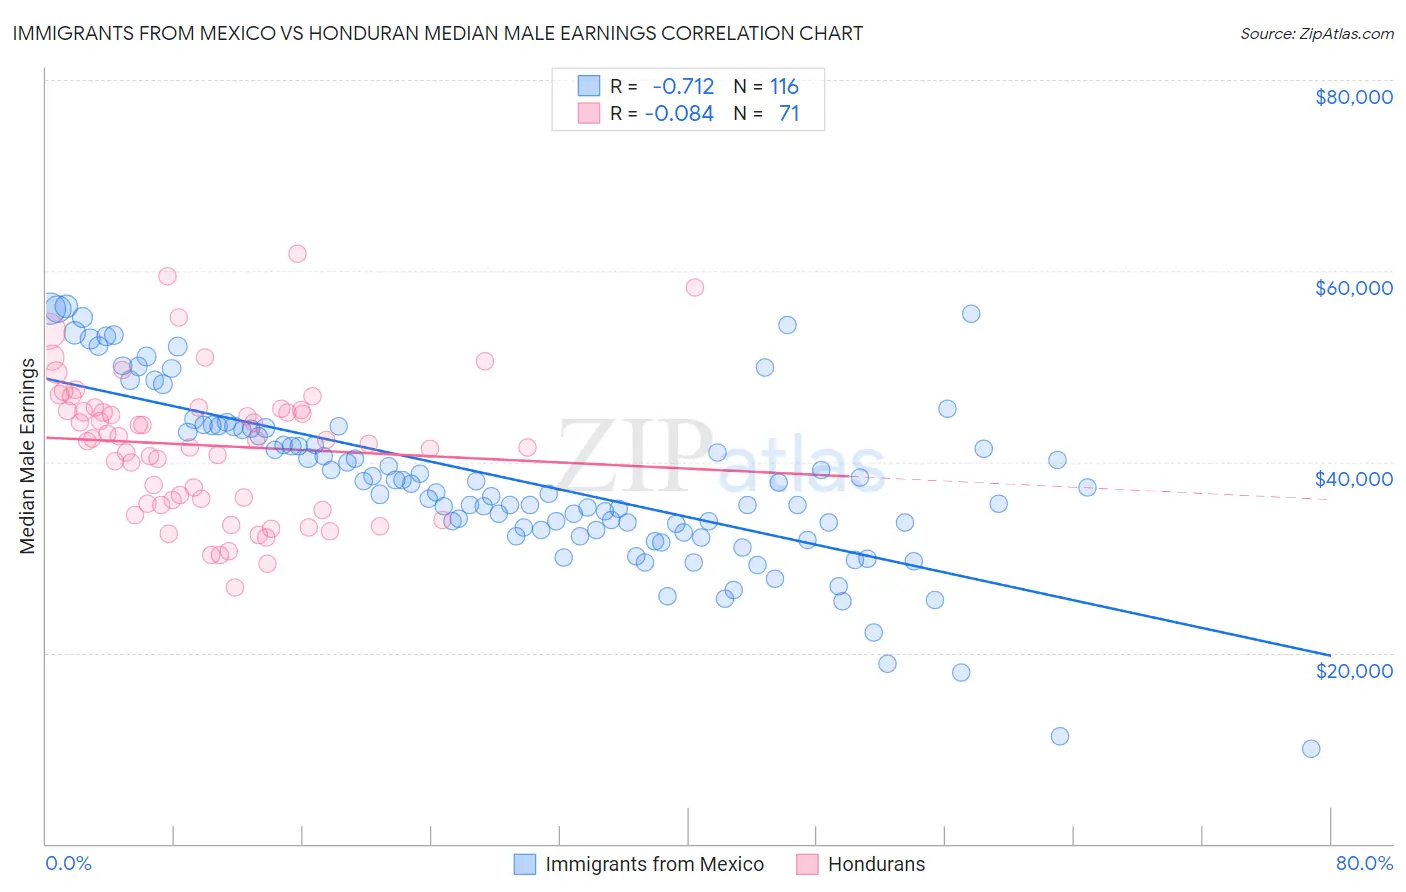
Immigrants from Mexico vs Honduran Median Male Earnings Correlation Chart
The statistical analysis conducted on geographies consisting of 513,109,400 people shows a strong negative correlation between the proportion of Immigrants from Mexico and median male earnings in the United States with a correlation coefficient (R) of -0.712 and weighted average of $44,960. Similarly, the statistical analysis conducted on geographies consisting of 357,792,552 people shows a slight negative correlation between the proportion of Hondurans and median male earnings in the United States with a correlation coefficient (R) of -0.084 and weighted average of $46,374, a difference of 3.1%.
Median Male Earnings Correlation Summary
| Measurement | Immigrants from Mexico | Honduran |
| Minimum | $9,917 | $26,786 |
| Maximum | $56,239 | $61,786 |
| Range | $46,322 | $35,000 |
| Mean | $37,983 | $41,717 |
| Median | $37,054 | $42,264 |
| Interquartile 25% (IQ1) | $32,850 | $35,639 |
| Interquartile 75% (IQ3) | $43,508 | $45,572 |
| Interquartile Range (IQR) | $10,658 | $9,933 |
| Standard Deviation (Sample) | $9,092 | $7,373 |
| Standard Deviation (Population) | $9,053 | $7,321 |
Demographics Similar to Immigrants from Mexico and Hondurans by Median Male Earnings
In terms of median male earnings, the demographic groups most similar to Immigrants from Mexico are Yakama ($45,002, a difference of 0.090%), Kiowa ($45,094, a difference of 0.30%), Native/Alaskan ($44,775, a difference of 0.41%), Immigrants from Bahamas ($45,176, a difference of 0.48%), and Immigrants from Haiti ($45,266, a difference of 0.68%). Similarly, the demographic groups most similar to Hondurans are Chippewa ($46,368, a difference of 0.010%), Hispanic or Latino ($46,419, a difference of 0.10%), Apache ($46,429, a difference of 0.12%), Immigrants from Guatemala ($46,244, a difference of 0.28%), and Immigrants from Caribbean ($46,193, a difference of 0.39%).
| Demographics | Rating | Rank | Median Male Earnings |
| Apache | 0.0 /100 | #311 | Tragic $46,429 |
| Hispanics or Latinos | 0.0 /100 | #312 | Tragic $46,419 |
| Hondurans | 0.0 /100 | #313 | Tragic $46,374 |
| Chippewa | 0.0 /100 | #314 | Tragic $46,368 |
| Immigrants | Guatemala | 0.0 /100 | #315 | Tragic $46,244 |
| Immigrants | Caribbean | 0.0 /100 | #316 | Tragic $46,193 |
| Mexicans | 0.0 /100 | #317 | Tragic $46,147 |
| Cheyenne | 0.0 /100 | #318 | Tragic $46,062 |
| Haitians | 0.0 /100 | #319 | Tragic $45,903 |
| Immigrants | Honduras | 0.0 /100 | #320 | Tragic $45,787 |
| Fijians | 0.0 /100 | #321 | Tragic $45,607 |
| Sioux | 0.0 /100 | #322 | Tragic $45,566 |
| Immigrants | Central America | 0.0 /100 | #323 | Tragic $45,538 |
| Blacks/African Americans | 0.0 /100 | #324 | Tragic $45,523 |
| Yuman | 0.0 /100 | #325 | Tragic $45,446 |
| Immigrants | Haiti | 0.0 /100 | #326 | Tragic $45,266 |
| Immigrants | Bahamas | 0.0 /100 | #327 | Tragic $45,176 |
| Kiowa | 0.0 /100 | #328 | Tragic $45,094 |
| Yakama | 0.0 /100 | #329 | Tragic $45,002 |
| Immigrants | Mexico | 0.0 /100 | #330 | Tragic $44,960 |
| Natives/Alaskans | 0.0 /100 | #331 | Tragic $44,775 |